
On this page
- The short version
- Most of these ads still lead with a still image
- Only 1 in 5 puts a price in the copy
- "Learn more" is the button they use most
- The copy is usually longer than a caption
- Most of these ads run on Facebook and Instagram together
- These searches mostly surface smaller pages
- What this means for the ad you design next
- Methodology
- How to cite this study
- Frequently Asked Questions
You are about to spend money on a Facebook ad for your shop, salon, or service, and you have to decide what goes in it. A still image or a video. A price, or no price. "Learn more," or a button that asks for the next step you actually want.
We coded 4,575 keyword-relevant local-business ads from the official Meta Ad Library on 12 November 2026. Only 19.9 percent put a price in the copy. 44.0 percent were still images. The most common button was "Learn more," on 23.9 percent of the ads.
This is a study of what those ads contain, not of which ads convert. Meta does not publish spend or impression totals for ordinary commercial ads the way it does for regulated categories. The useful takeaway is simpler: most local ads in this sample still lead with a still image, most leave the price out, and most default to a soft button. You can copy that, or you can be more specific.
The short version
In a study of 4,575 keyword-relevant local-business ads from the official Meta Ad Library on 12 November 2026, only 19.9 percent put a price in the copy, 44.0 percent were still images, and the most common button was Learn more, on 23.9 percent of ads. This is a study of what the ads contain, not of which ads convert.
A still image is still the main format. 2,013 ads, or 44.0 percent, were still images. Carousels were 25.5 percent. Video was 18.6 percent. On pages with fewer than 50,000 likes, a size proxy rather than a legal definition of a small business, still images rise to 49.0 percent.
Price is the exception, not the rule. 910 ads, 19.9 percent, mentioned a price in the copy. 16.8 percent used offer language such as a sale, discount, or coupon. 9.2 percent advertised a free consult, estimate, quote, or related offer. Beauty and health mentioned a price more often than restaurants.
"Learn more" is the habit button. It appeared on 1,092 ads, 23.9 percent, ahead of "Shop now" at 16.2 percent. Among ads from pages with fewer than 50,000 likes, "Shop now" drops to 10.7 percent, and buttons like "Contact us," "Book now," "Get quote," "Send message," and "Call now" are more common. 4.5 percent of all relevant ads had no button at all.
The copy is usually real writing, not a short caption. 97.7 percent of the ads had primary body text. 47.4 percent ran longer than 300 characters. The median body was 281 characters. 87.0 percent of the ads listed both Facebook and Instagram as placements.
Most of these ads still lead with a still image
If you have been told that a local Facebook ad has to be a video now, this sample does not back that up. A still image was the single most common format.
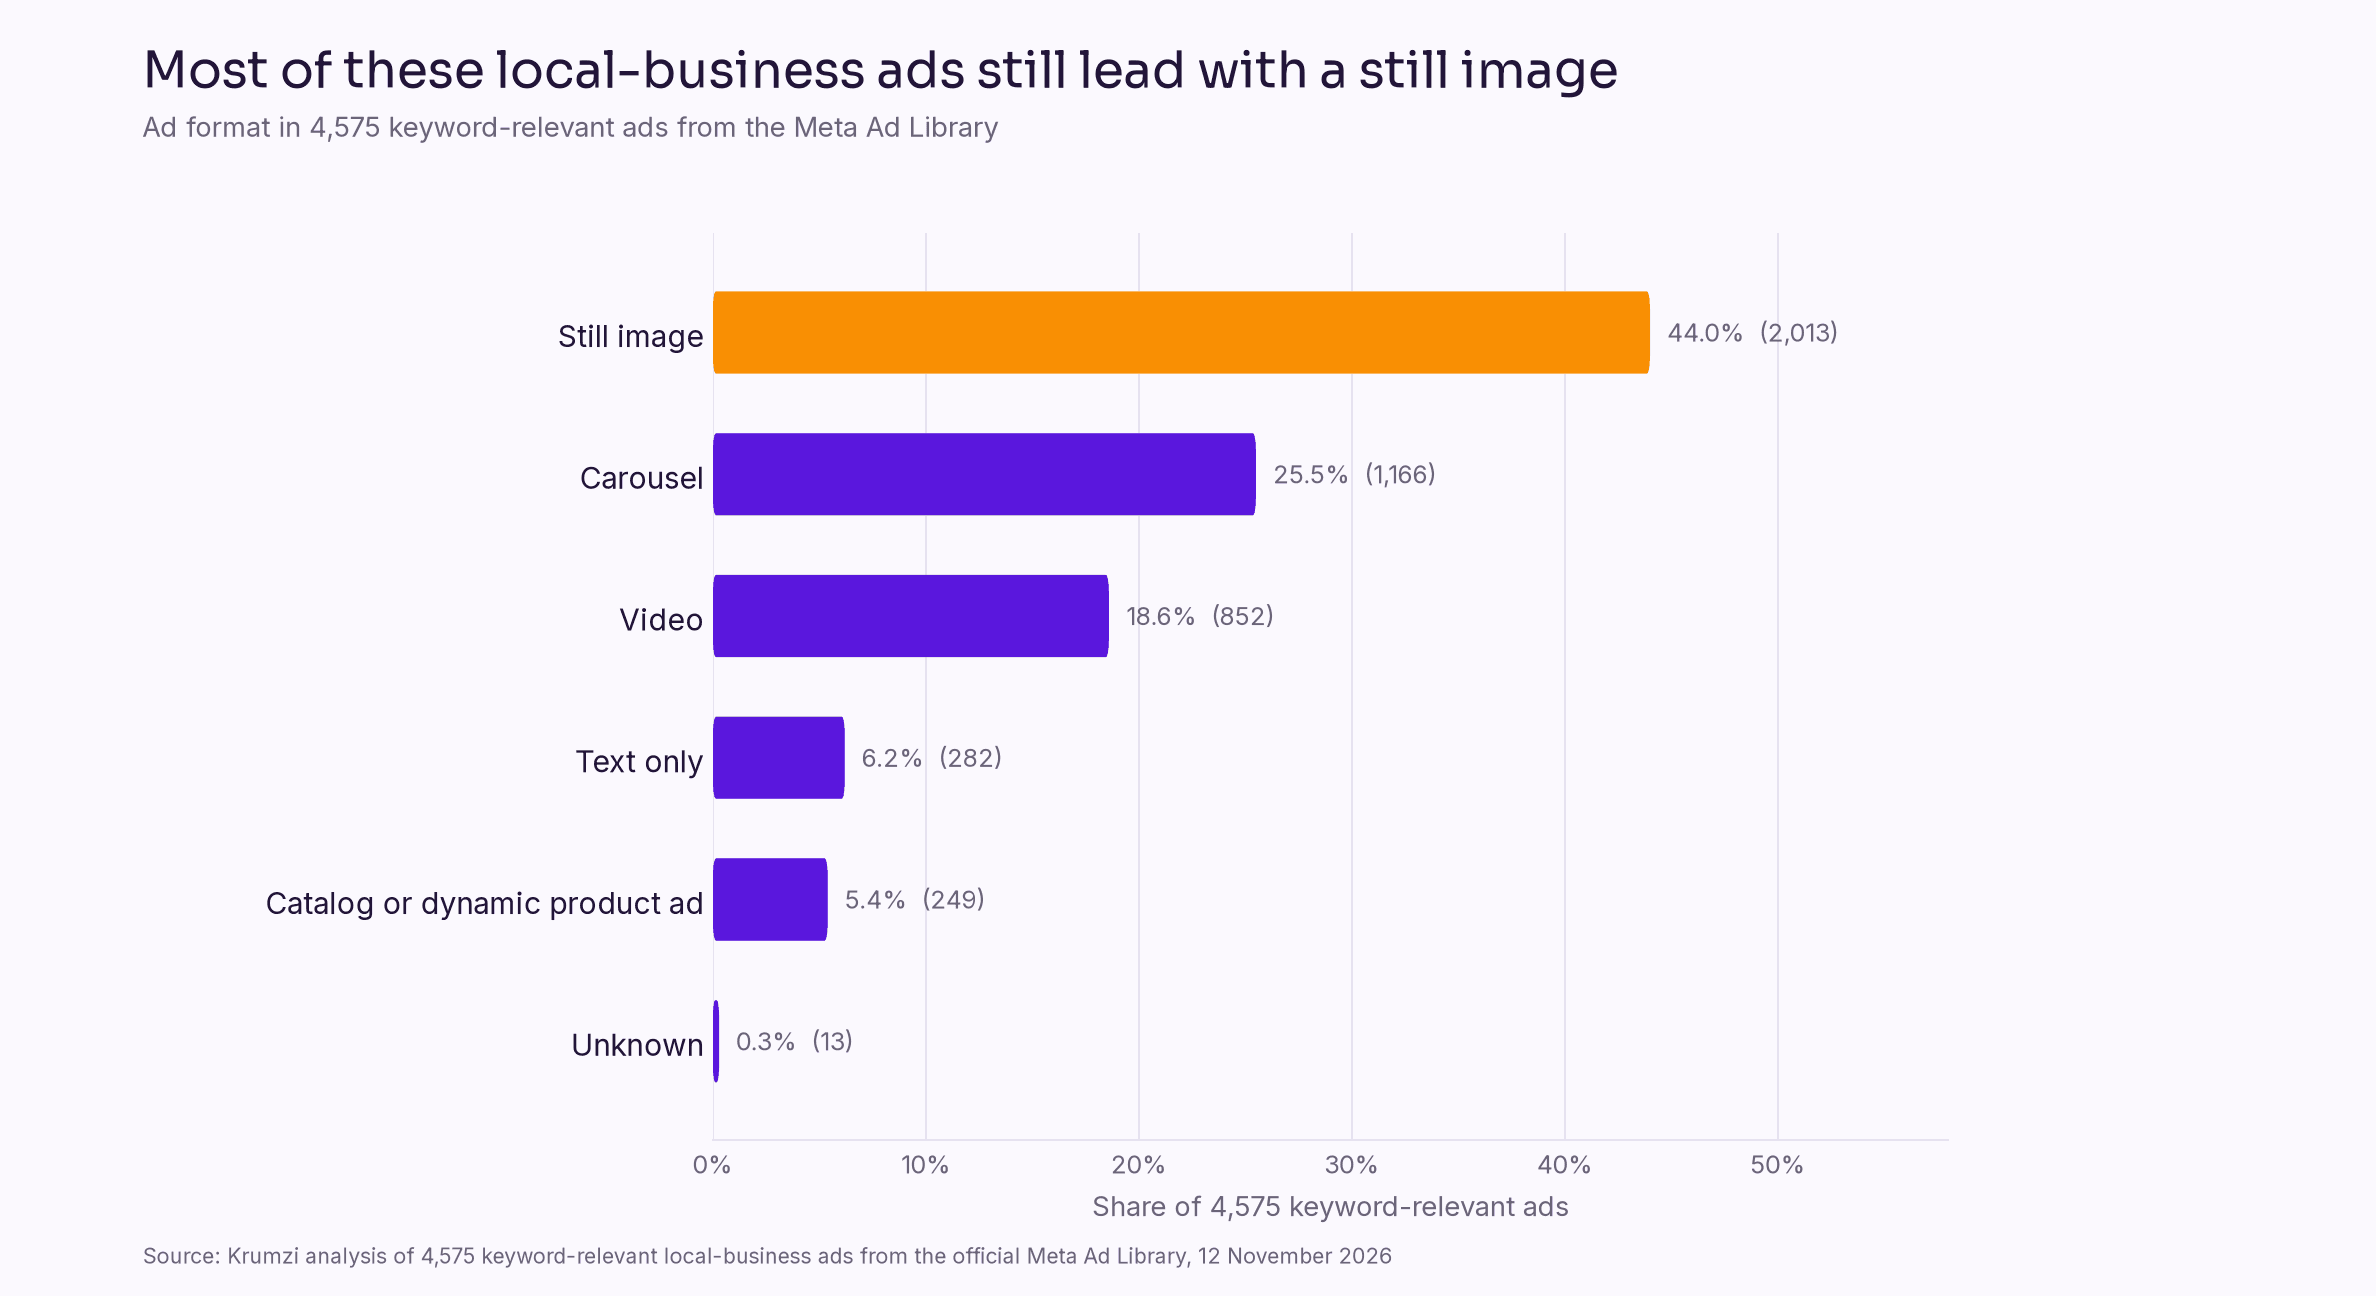
Of the 4,575 keyword-relevant ads, 2,013 were still images (44.0 percent), 1,166 were carousels (25.5 percent), and 852 were videos (18.6 percent). Text-only ads were 6.2 percent. Catalog or dynamic product ads were 5.4 percent. Thirteen ads, 0.3 percent, had an unknown format.
The mix shifts once you look at the 3,883 ads from pages with fewer than 50,000 likes. Still images rise to 49.0 percent. Catalog and dynamic product ads fall to 1.0 percent. Video stays about the same, at 18.3 percent. Larger pages are more likely to use catalog setups. Smaller pages are more likely to run a single still.
That does not mean video is a bad idea. It means a clear still image is still a normal, defensible starting point, especially if you can produce a sharp photo faster than a sharp video. If you do go to video, keep the length tight. Our guide to how long a video ad should be walks through the platform ranges. For the still itself, start with a 4:5 frame so the same file can work as a feed post and as an ad. The exact dimensions are in Facebook post size and the social media image size guide.
Only 1 in 5 puts a price in the copy
This is the number worth quoting. In 4,575 keyword-relevant ads, only 910, or 19.9 percent, mentioned a price in the copy.
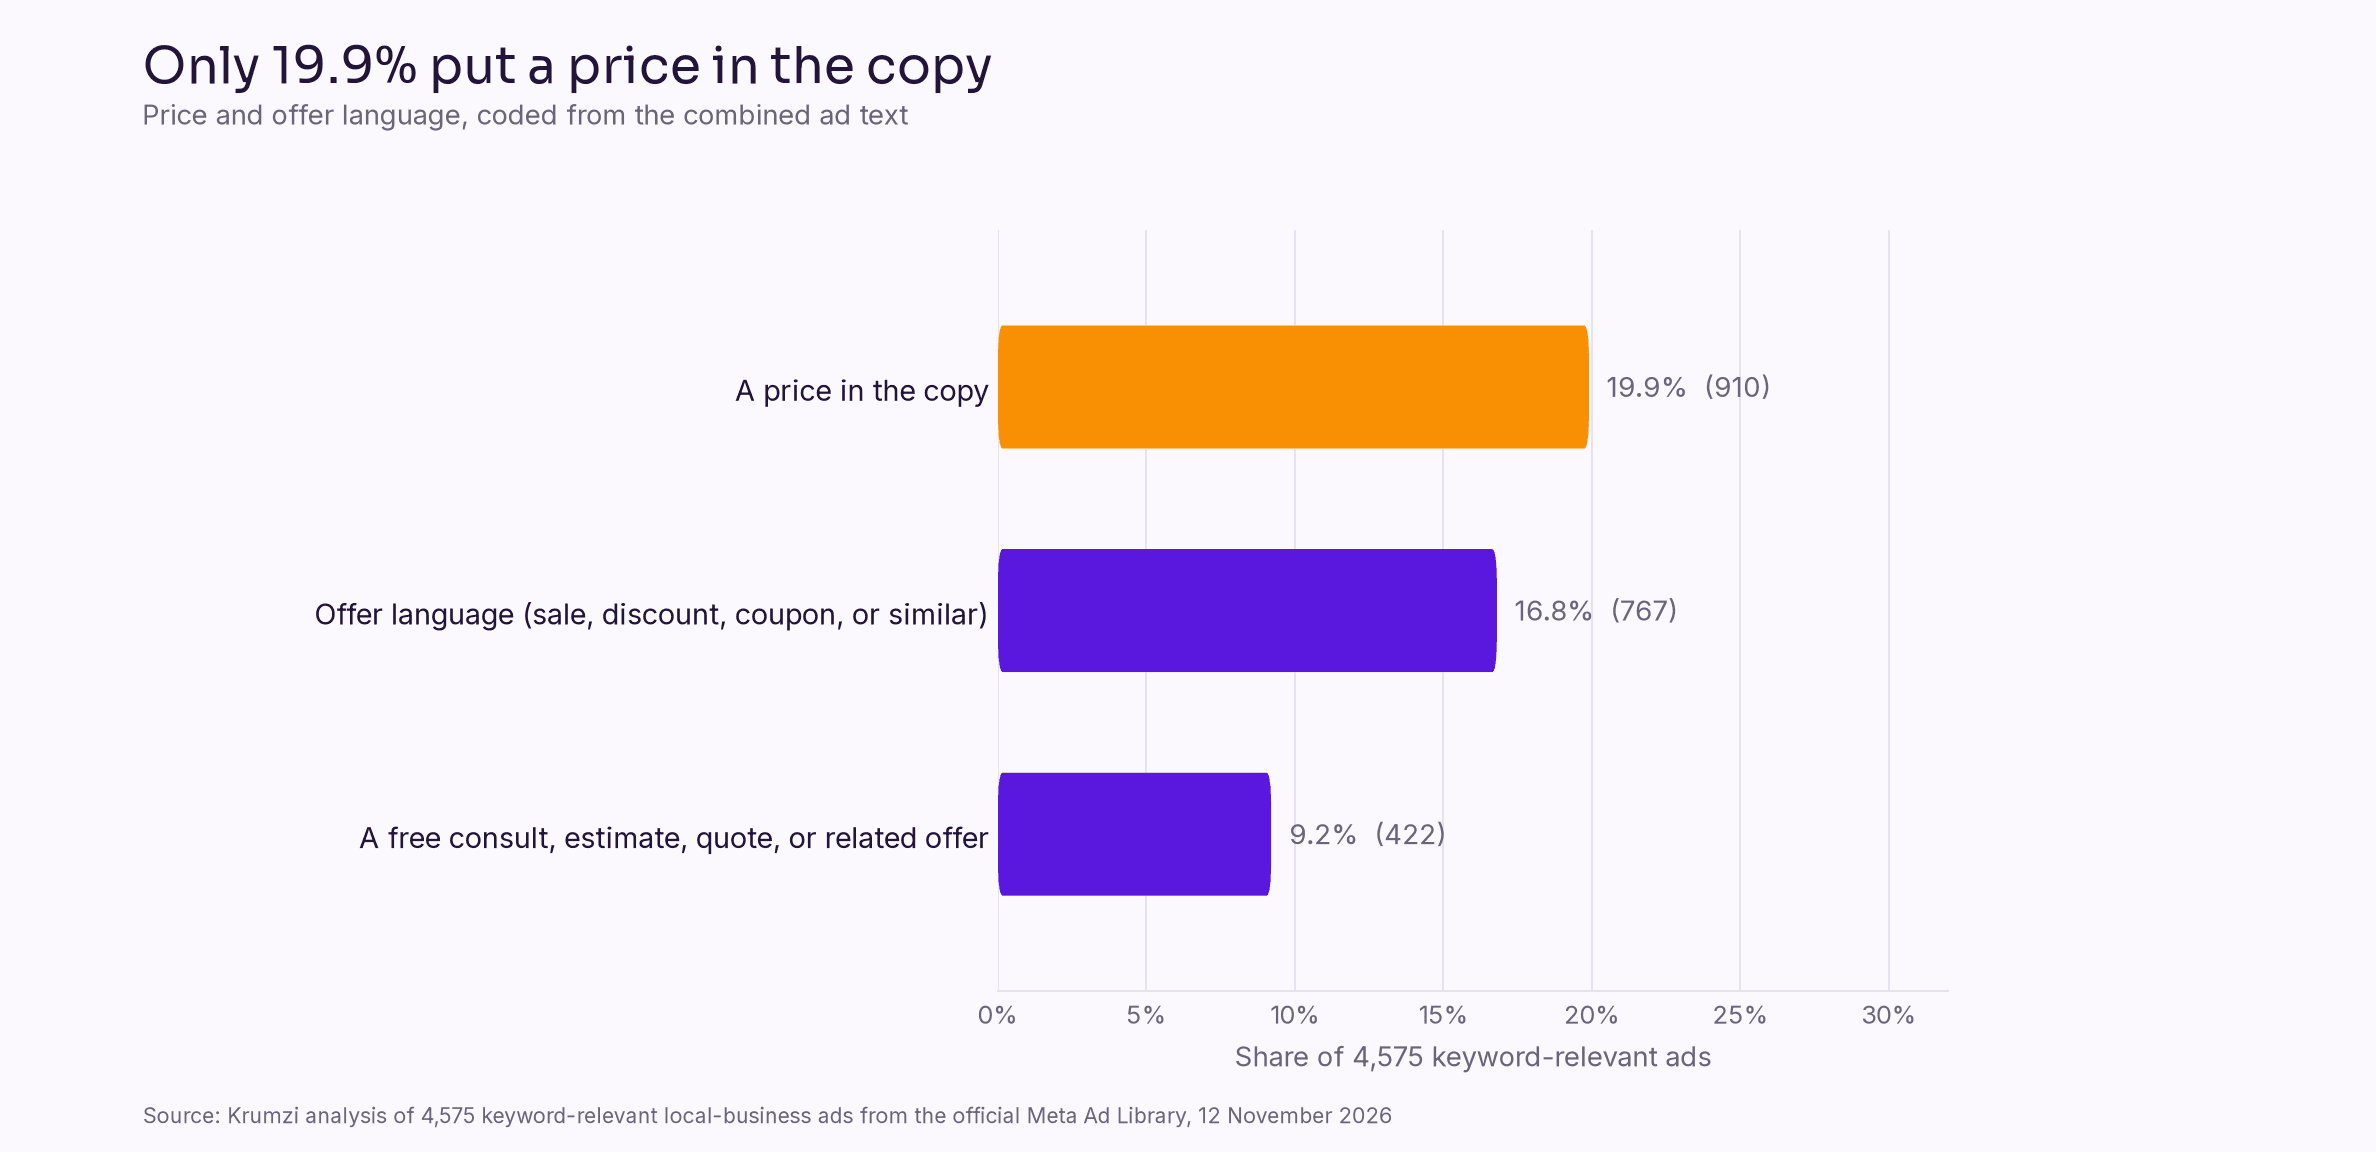
We coded a price as a dollar amount, a percent off, or phrasing such as "starting at," "now only," "as low as," or "priced at," anywhere in the combined text. Offer language is broader: a sale, discount, deal, coupon, promo, BOGO, limited time, flash sale, special offer, or a free consult, estimate, quote, shipping, trial, exam, visit, or gift. 767 ads, 16.8 percent, used that offer language. The narrower free-consult and free-estimate subset showed up in 422 ads, or 9.2 percent.
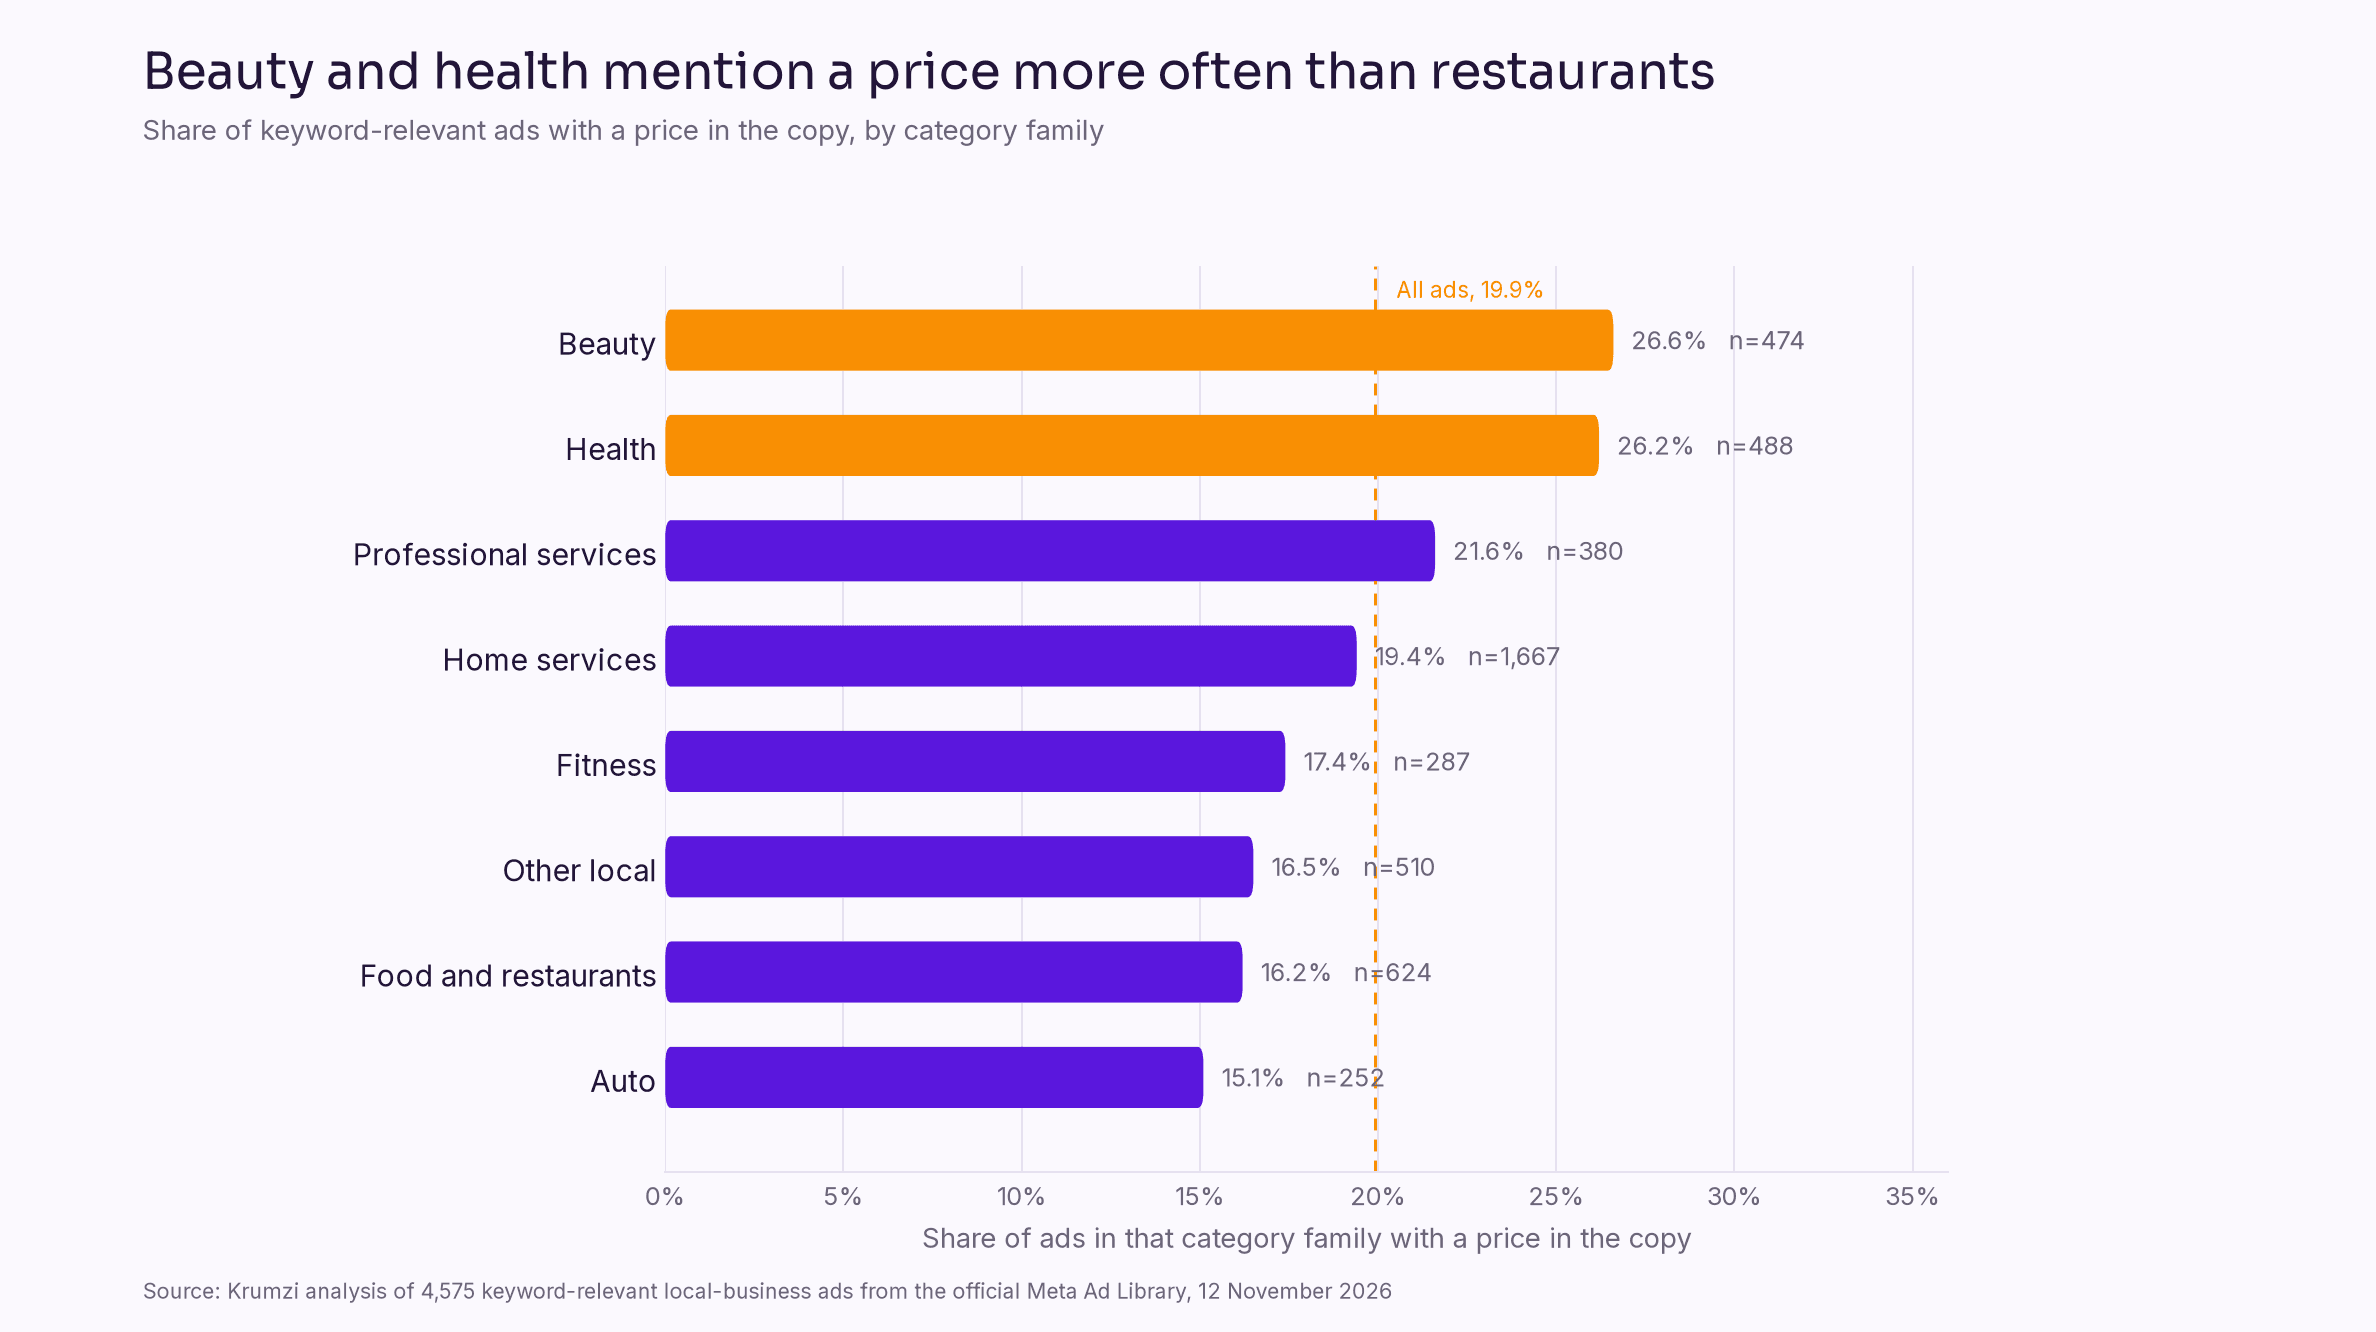
The rate is not the same in every category. Beauty mentioned a price in 26.6 percent of ads, and health in 26.2 percent. Food and restaurants did so in 16.2 percent. Auto was lowest, at 15.1 percent. Home services, the largest family in this sample because we ran more of those queries, sat right on the overall average at 19.4 percent.
We cannot say, from this data, that a priced ad outperforms a no-price ad. What we can say is that a price is still unusual. If you have a number, a starting-at figure, or a free estimate, putting it in the copy is a simple way to be more specific than most ads in your category.
"Learn more" is the button they use most
The most common recorded call-to-action was "Learn more," on 1,092 ads, or 23.9 percent. "Shop now" was second, at 16.2 percent. After that, the list gets more local: "Book now" at 7.2 percent, "Contact us" at 6.8 percent, and "Get quote" at 6.1 percent.
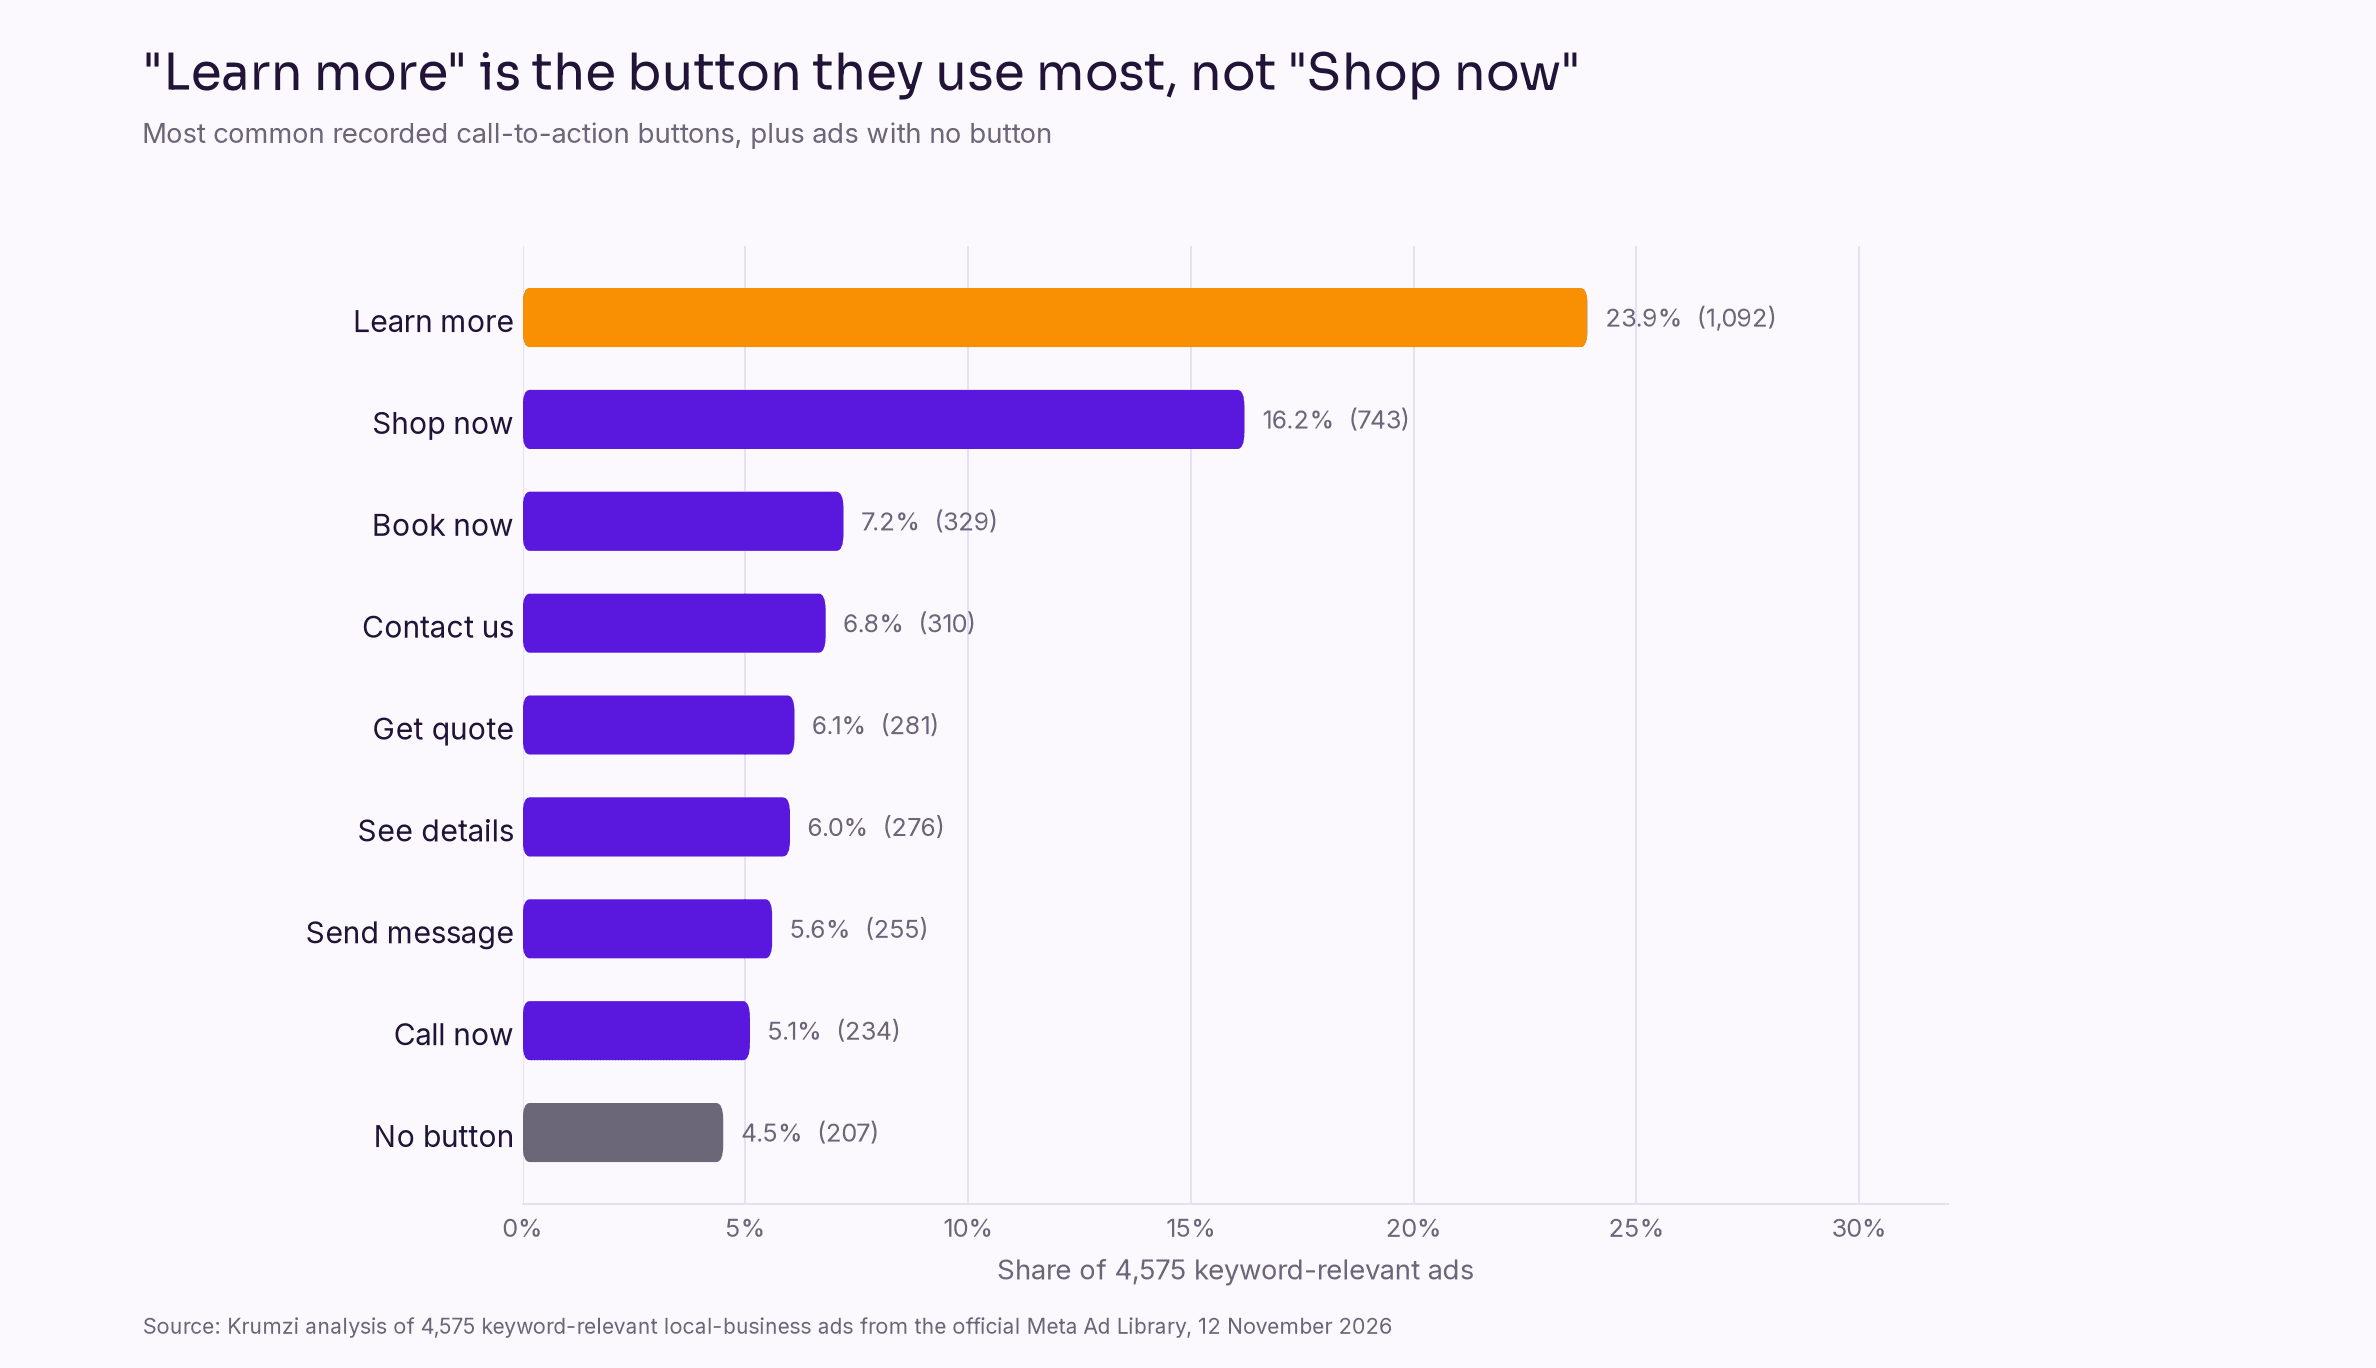
Among the 3,883 ads from pages with fewer than 50,000 likes, the picture changes in a useful way. "Learn more" stays first, at 24.4 percent. "Shop now" drops to 10.7 percent. "Contact us," "Book now," "Get quote," "Send message," and "Call now" sit at 8.0, 7.1, 6.7, 6.5, and 6.0 percent. Smaller pages lean toward a conversation or a booking, not a checkout.
207 relevant ads, 4.5 percent, had no button. That is a miss. A button is one of the few things Meta lets you set in plain language. Meta's own guidance is to pick a call-to-action that matches the campaign objective, and the list of available buttons changes with that objective. If you want someone to book, use "Book now." If you want a quote, use "Get quote." "Learn more" is fine when the next step really is a page of information. It is a weak default when you actually want a call, a booking, or a message.
For the rest of the setup, from the objective through the creative, how to make a Facebook ad walks through the steps.
The copy is usually longer than a caption
Almost every ad in this sample had primary body text: 4,470 ads, or 97.7 percent. Only 105 ads, 2.3 percent, had none.
The length buckets tell you more than the average. 47.4 percent were long, meaning more than 300 characters. 40.5 percent were medium, 80 to 300 characters. 9.8 percent were short, under 80 characters. The median body was 281 characters. The mean was 742, because a smaller set of ads runs very long and pulls the average up. Among ads from pages with fewer than 50,000 likes, long bodies rise to 51.3 percent, and the median is 314 characters.
The practical point is straightforward. A couple of short paragraphs is normal in this set. A headline with no body is not. Write the offer, the what, and the next step in the primary text, not only on the image. The image still has to stand on its own when someone is scrolling, but the body is where most of these ads do the explaining.
Most of these ads run on Facebook and Instagram together
87.0 percent of the relevant ads listed both Facebook and Instagram. 96.5 percent included Facebook, and 89.7 percent included Instagram. Audience Network appeared on 54.5 percent, Messenger on 43.6 percent, and Threads on 40.0 percent. Instagram-only ads were just 2.7 percent. Facebook-only ads were 9.5 percent.
If you design for one square and hope it crops cleanly everywhere, you are fighting the placement mix. Build the visual so it still works in a 4:5 frame, keep the important text out of the edges, and assume the same creative may also show on Instagram. The size guides linked above cover the safe starting dimensions.
These searches mostly surface smaller pages
Page like counts are a size proxy. They are not a legal definition of a small business. A local shop can have a large page, and a national brand can have a small one. We still report the buckets because they describe who showed up in these keyword searches.
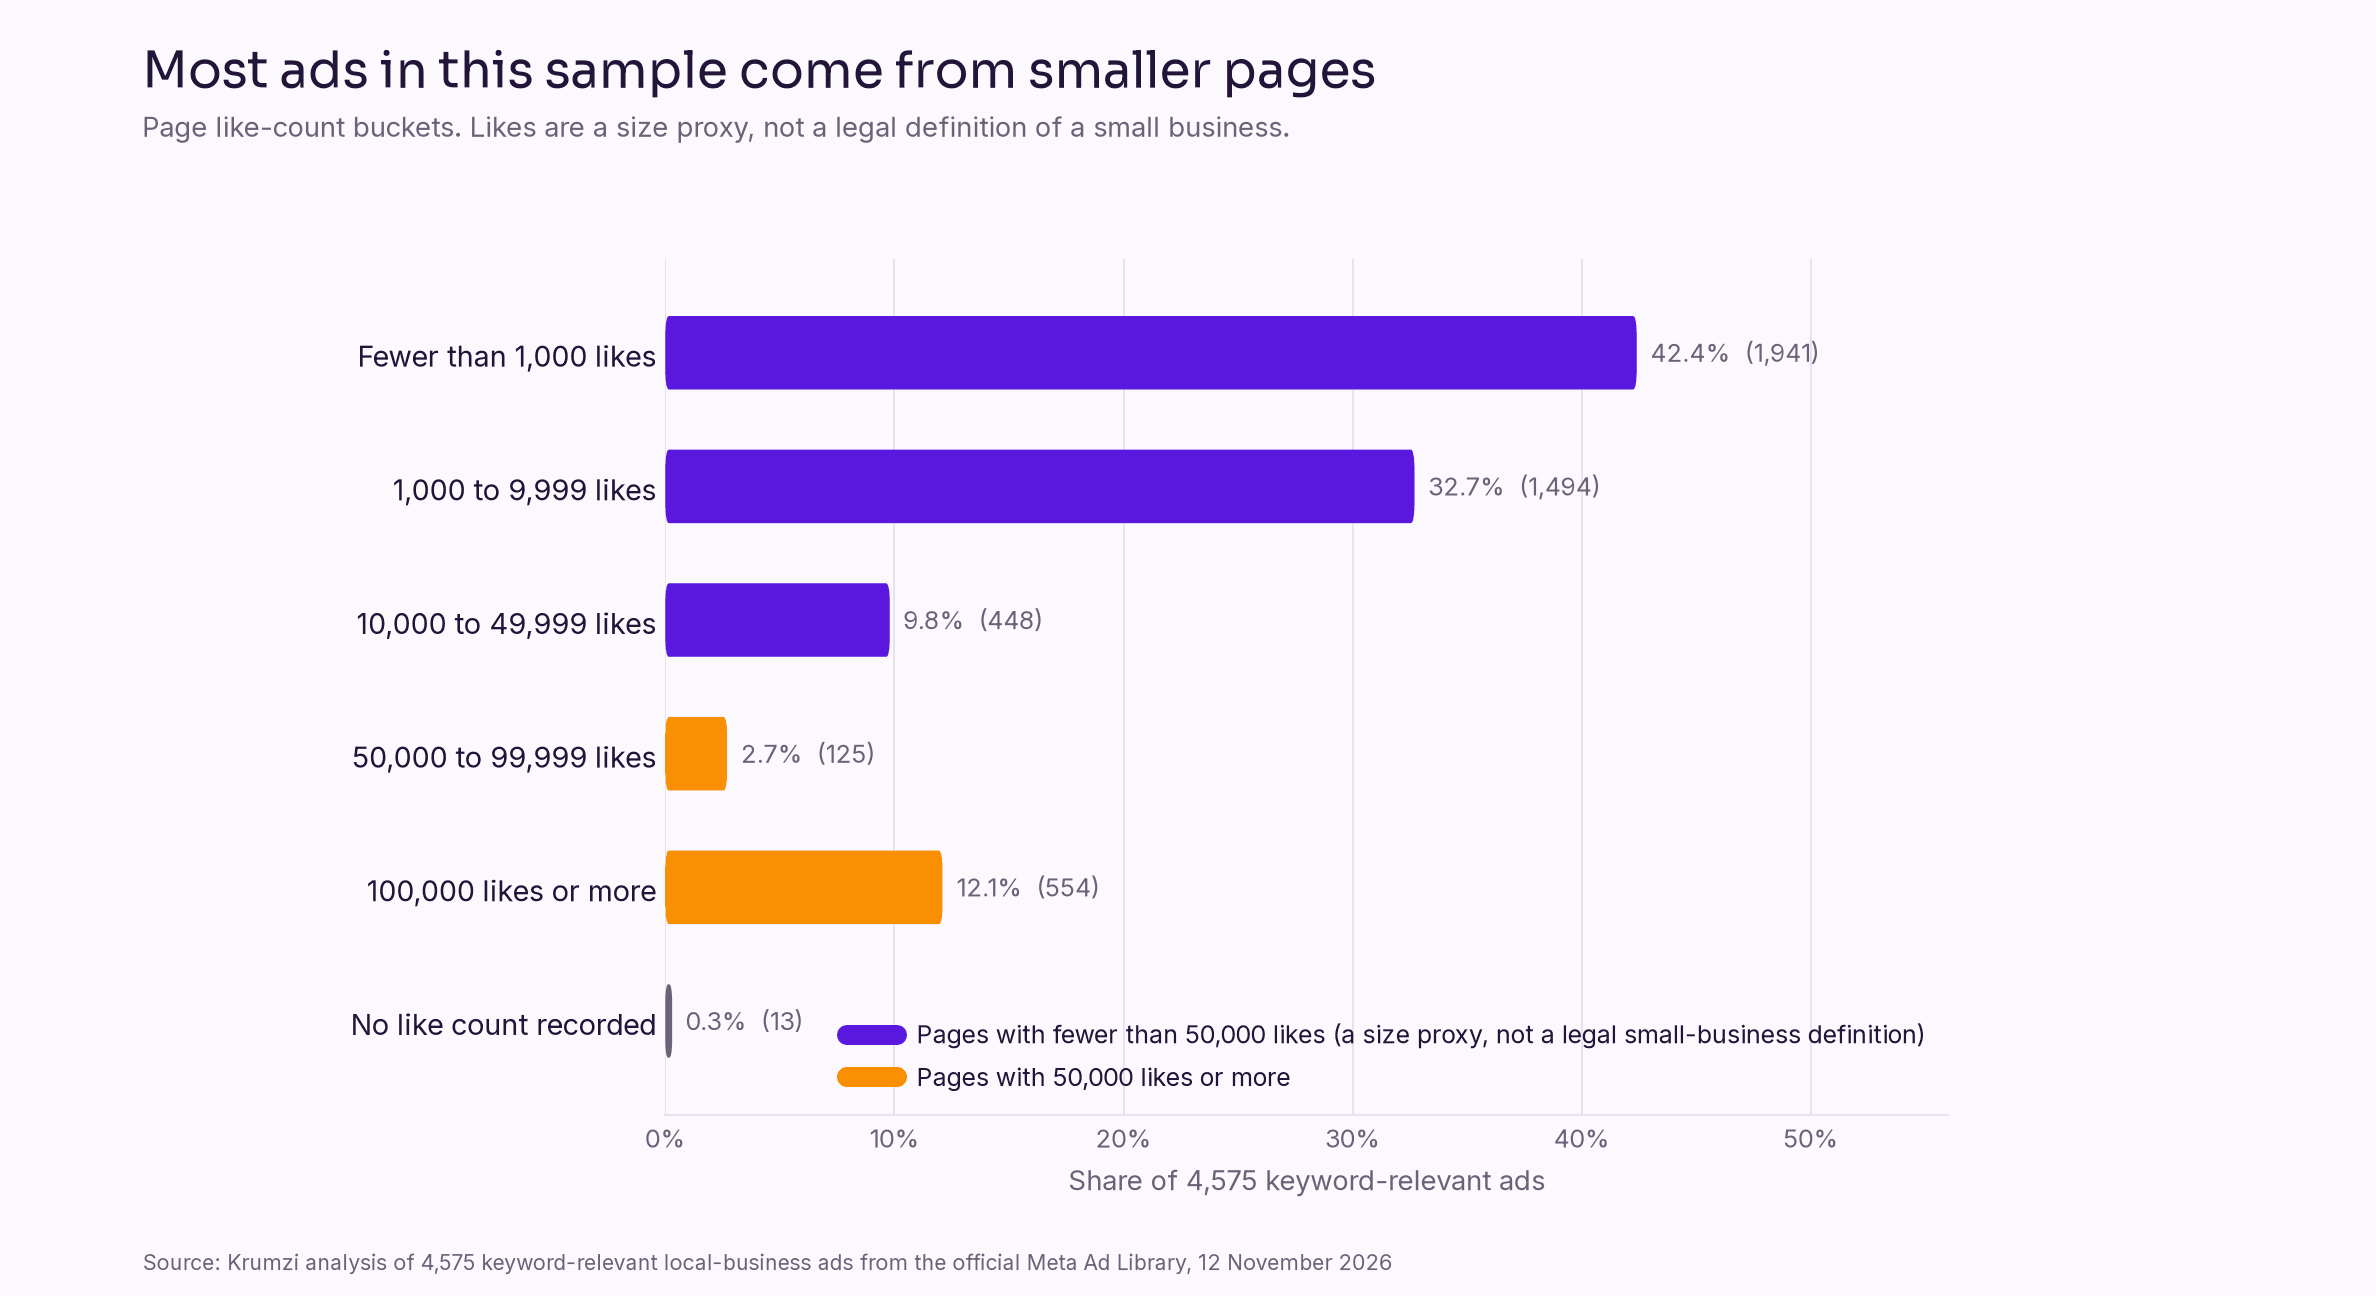
Of the 4,575 relevant ads, 1,941 (42.4 percent) came from pages with fewer than 1,000 likes, 1,494 (32.7 percent) from pages with 1,000 to 9,999 likes, and 448 (9.8 percent) from pages with 10,000 to 49,999 likes. Together, 3,883 ads, or 84.9 percent, came from pages under 50,000 likes. 125 ads (2.7 percent) came from pages with 50,000 to 99,999 likes, and 554 (12.1 percent) from pages with 100,000 likes or more. Thirteen ads had no like count.
National brands can still pass the keyword test and sit in this sample. The 50,000-like cut is a way to look at a smaller-page subset, not a claim that every ad below that line is a small business. On the findings that use that subset, the main story does not flip: still images are even more common, "Shop now" is less common, and long body copy is slightly more common.
What this means for the ad you design next
Use this sample as a check on your next ad, not as a formula to copy.
Start with a still image if that is what you can make well. Video is 18.6 percent of the set, not the default. A sharp photo, a clear headline, and a readable 4:5 crop will put you in the format most of these ads already use.
Put the number in the copy if you have one. A price, a starting-at figure, a percent off, or a free estimate is still unusual. In most categories here, four out of five ads leave it out.
Pick the button for the next step you want, not the one you see most often. "Learn more" is common. "Book now," "Get quote," "Call now," and "Contact us" are closer to how a local business actually wants someone to respond. And put a button on the ad. 4.5 percent of this sample did not.
Write a real primary text. A few hundred characters is normal. Say what you offer, who it is for, and what happens after the click.
Design once for Facebook and Instagram together. 87.0 percent of these ads already run on both.
If the words are ready and the blank canvas is the slow part, Krumzi can turn a short brief into an editable ad design you can still fix before you spend. That is useful when you want a still, a few variations, and a 4:5 crop without rebuilding each one by hand. For the workflow, see how to create ad creatives with AI. If you are comparing tools, the best AI ad generators covers that separately. And if the paid ad is meant to sit next to a stronger page, how to grow a Facebook page is the organic side of the same job.
Methodology
This study codes publicly available ads from the official Meta Ad Library. It does not name businesses, republish individual ads, or claim that any ad is AI-generated. Image pixels and video frames were not analyzed, so the study does not report faces, people, typography, or color palettes. Meta describes the Ad Library as a public search of ads running across Meta products.
Source and date. We retrieved active US ads on 12 November 2026 through the official Meta Ad Library, using 65 local-business category queries with a cap of 100 results each. Examples include pizza restaurant, coffee shop, hair salon, dentist office, HVAC repair, and realtor. The 65 queries returned 6,376 rows and 6,014 unique ads, after deduplicating on Meta's ad archive id.
The sample is large, but it is not a census. Once a search goes past the first Library view, the remaining results are split by media type and are no longer in the Library's default order. All 65 queries in this pull used that media-type split, and 45 of them hit the 100-result cap. This is therefore a sample of up to 100 active US ads per keyword, split across media-type views. It is not a random sample of all Meta ads, and it is not a complete count of local-business advertising. We pulled ads listed as active on that day, not ads that ran only in the past.
Relevance. Keyword search in the Ad Library also returns off-topic ads that happen to mention the query term. Each query was assigned to a category family: food and restaurants, beauty, fitness, health, home services, auto, professional services, or other local. An ad is coded keyword-relevant if the combined text of its body, title, page name, link caption, and card text matches at least one documented term from the family of a query that retrieved it. The largest credible keyword-relevant sample in this pull is 4,575 unique ads, or 76.1 percent of the 6,014 unique rows. That is short of a 5,000-ad target, and we did not fill the gap with weaker matches.
Relevance rates vary by query, from 37 percent for "cleaning service" and "moving company" to 95 percent or more for "gutter cleaning," "orthodontist," "pizza restaurant," and "roofing company." This is a text heuristic, not a manual audit of every row. Some relevant ads may still be national brands or marketplace ads that use the same words. Some relevant local ads may be missed if they never use the family terms in the text.
Category mix. Home-services queries were numerous, 22 of the 65, so that family is 36.4 percent of the relevant sample. That is a function of the query mix, not a measure of advertising market share. An ad can belong to more than one family if it matched more than one.
Smaller-page proxy. Page like counts are a size proxy, not a legal definition of a small business. The study reports like-count buckets and a cut at fewer than 50,000 likes. Among keyword-relevant ads, 3,883 (84.9 percent) come from pages under that cut, including 1,941 (42.4 percent) from pages with fewer than 1,000 likes. Like counts can be missing or outdated. Thirteen relevant ads had no like count. Findings that use the under-50,000-likes subset are labeled as such.
Coding. Each unique ad is coded from Library fields only. Format comes from Meta's display format plus counts of videos, images, and cards. Body length is the character count of the primary body field. Price, offer, and free-offer flags use the regular expressions described above. The call-to-action is the recorded button text, or a normalized label, or a card button if the parent field is empty. Platforms are the ones listed on the ad: Facebook, Instagram, Audience Network, Messenger, and Threads. No model was used to guess whether creative was AI-generated.
What we cannot say. Spend and impression fields are generally unavailable for these commercial ads. Those breakdowns are for ads in Meta's regulated categories. This study therefore does not rank what performs, only what appears in the copy and metadata of this sample.
How to cite this study
Please cite: Krumzi, "Only 19.9% of 4,575 Local Facebook Ads Show a Price," 12 November 2026, https://www.krumzi.com/blog/local-facebook-ads-2026. The underlying ads were retrieved from the official Meta Ad Library on 12 November 2026. The study codes 4,575 keyword-relevant local-business ads and does not republish individual ads or name businesses.
Frequently Asked Questions
Do most local Facebook ads use video?
No. In this sample of 4,575 keyword-relevant local-business ads, 44.0 percent were still images, 25.5 percent were carousels, and 18.6 percent were video. On pages with fewer than 50,000 likes, still images rise to 49.0 percent. A still image is still a normal starting point.
How many local Facebook ads show a price?
Only 19.9 percent of the 4,575 ads in this study mentioned a price in the copy. 16.8 percent used broader offer language, and 9.2 percent advertised a free consult, estimate, quote, or related offer. Beauty and health mentioned a price more often, at 26.6 percent and 26.2 percent, than food and restaurants, at 16.2 percent.
What is the most common button on local Facebook ads?
"Learn more," on 23.9 percent of the 4,575 ads, ahead of "Shop now" at 16.2 percent. Among ads from pages with fewer than 50,000 likes, "Shop now" falls to 10.7 percent, and buttons such as "Contact us," "Book now," and "Get quote" are more common. 4.5 percent of all relevant ads had no button.
Is this a study of small businesses?
No. It is a study of keyword-relevant local-business ads in the Meta Ad Library. Page like counts are a size proxy, not a legal definition of a small business. 84.9 percent of the relevant ads came from pages with fewer than 50,000 likes, including 42.4 percent from pages with fewer than 1,000 likes, but national brands can still appear in the sample.
Can I look up these ads myself?
Yes. The ads came from the official Meta Ad Library, which is public. This article does not name businesses or republish individual ads, so use the Library's own search if you want to see live examples in a category.
Want the design part done for you? Start free trial and describe your first ad.
3-day free trial, card needed. No charge until day 4. Cancel online anytime.
A month of posts, designed before your coffee cools
Describe the post. Krumzi designs it from scratch, on your brand, fully editable.
Start free trial3-day free trial, card needed. No charge until day 4. Cancel online anytime.


