On this page
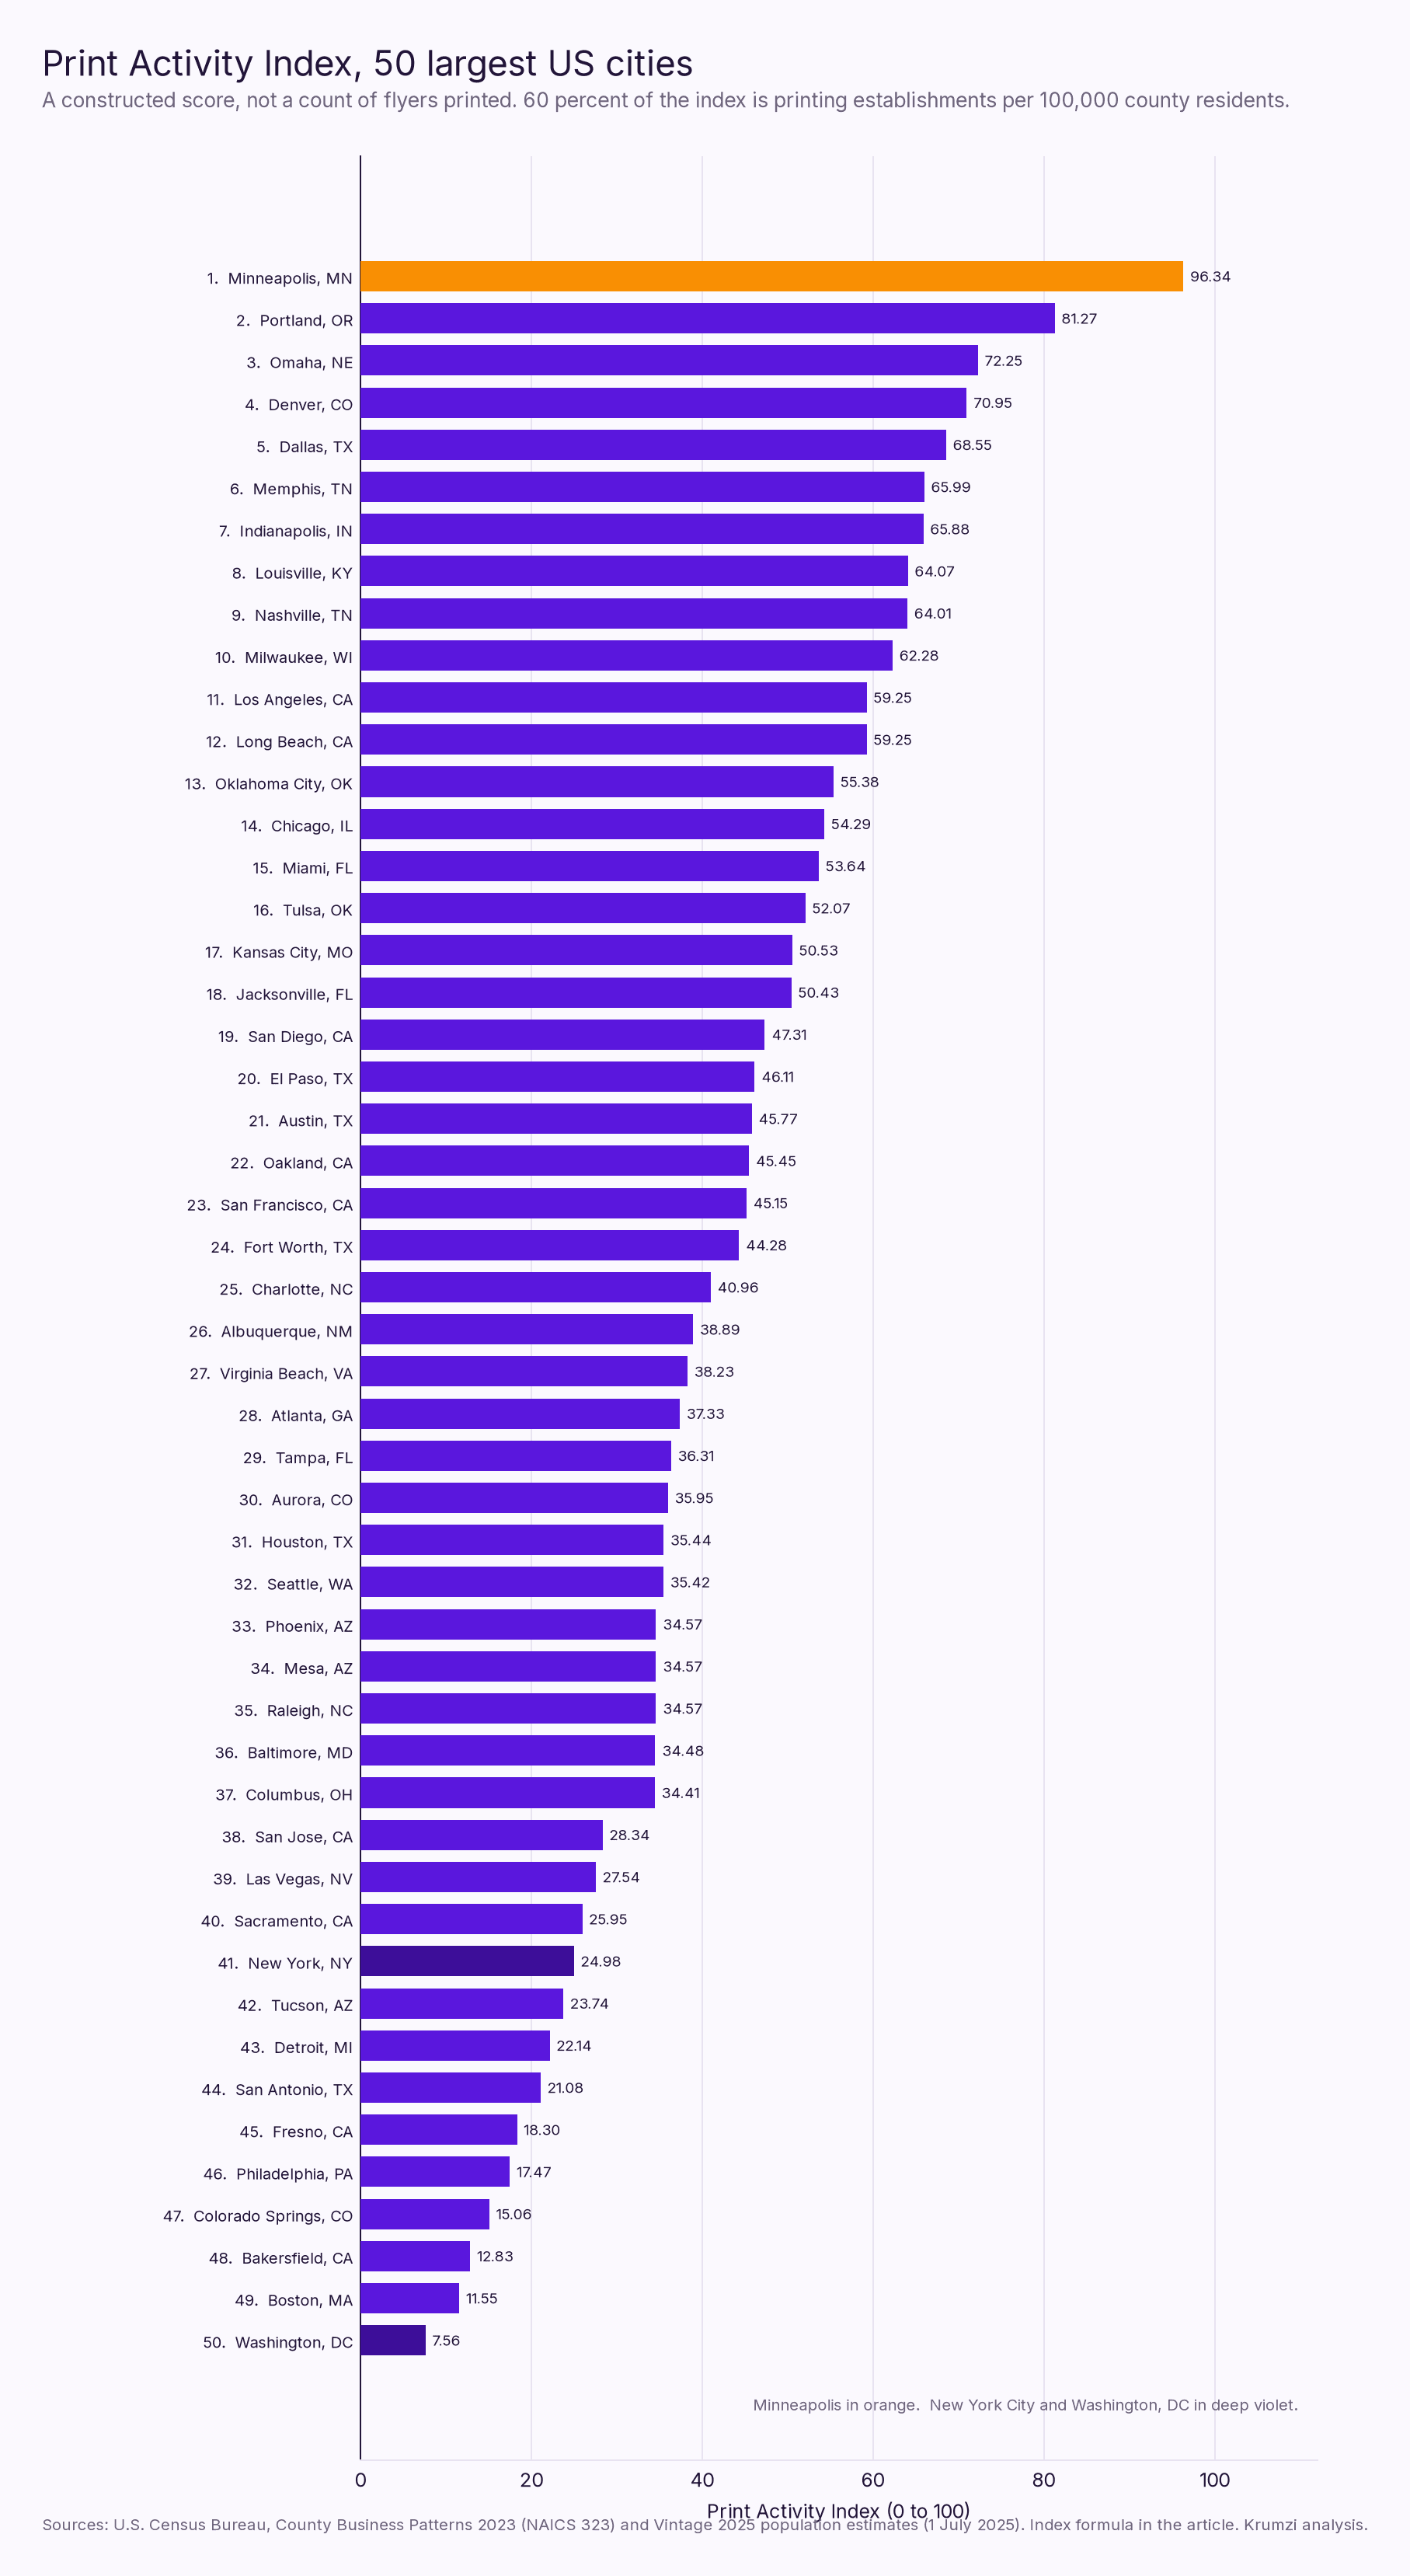
Minneapolis has 3.8 times as many printing establishments per capita as Washington, DC. Among the 50 largest US cities, Minneapolis ranks first on the Print Activity Index. New York City, the largest city in the set, ranks 41st. Washington ranks last.
This is not a count of flyers printed, print impressions, or print-shop revenue. The index measures printing establishments per capita in each city's principal county, plus how large printing is among local businesses, using Census County Business Patterns data for 2023. If you are deciding where to take a print job, or writing about the print trade in your city, this is the ranked list, with every city's row.
The short version
Minneapolis ranks first among the 50 largest US cities on the Print Activity Index, at 96.34. Hennepin County, which contains Minneapolis, has 13.15 printing establishments per 100,000 residents, 3.8 times the District of Columbia's rate of 3.46. New York City ranks 41st on the index. Every one of the 50 cities still has at least 100 Google Maps listings for "print shop." The Maps figure cannot rank the cities, because all 50 hit the search cap.
The biggest cities are not the densest. The top 10 are Minneapolis, Portland, Oregon, Omaha, Denver, Dallas, Memphis, Indianapolis, Louisville, Nashville, and Milwaukee. Los Angeles ranks 11th. Chicago ranks 14th. Houston ranks 31st. Boston ranks 49th.
The rates are county rates. Each city is scored on printing establishments in its principal county, divided by that county's 2025 population. Minneapolis does not fill all of Hennepin County. New York City's five boroughs and the District of Columbia do match the city, so those two rates are city-proper.
NAICS 323 is broader than flyers. The Census category is Printing and Related Support Activities. It includes books, labels, business forms, and other printing, not only marketing print. County Business Patterns also counts payroll establishments only, not one-person shops with no employees.
Minneapolis leads. Washington, DC sits last.
The gap on the raw rate is the easiest number to quote. Hennepin County has 169 printing establishments and 13.154 shops per 100,000 residents. The District of Columbia has 24 establishments and 3.460 per 100,000. Divide those rates and you get 3.8.
Portland, Oregon, is second, at 11.692 shops per 100,000 in Multnomah County. Denver is third on the per-capita rate, at 10.667, and Omaha is fourth, at 10.223. On the overall index, Omaha edges Denver for third, because printing is a larger share of Omaha's local businesses (0.371 percent vs 0.288 percent).
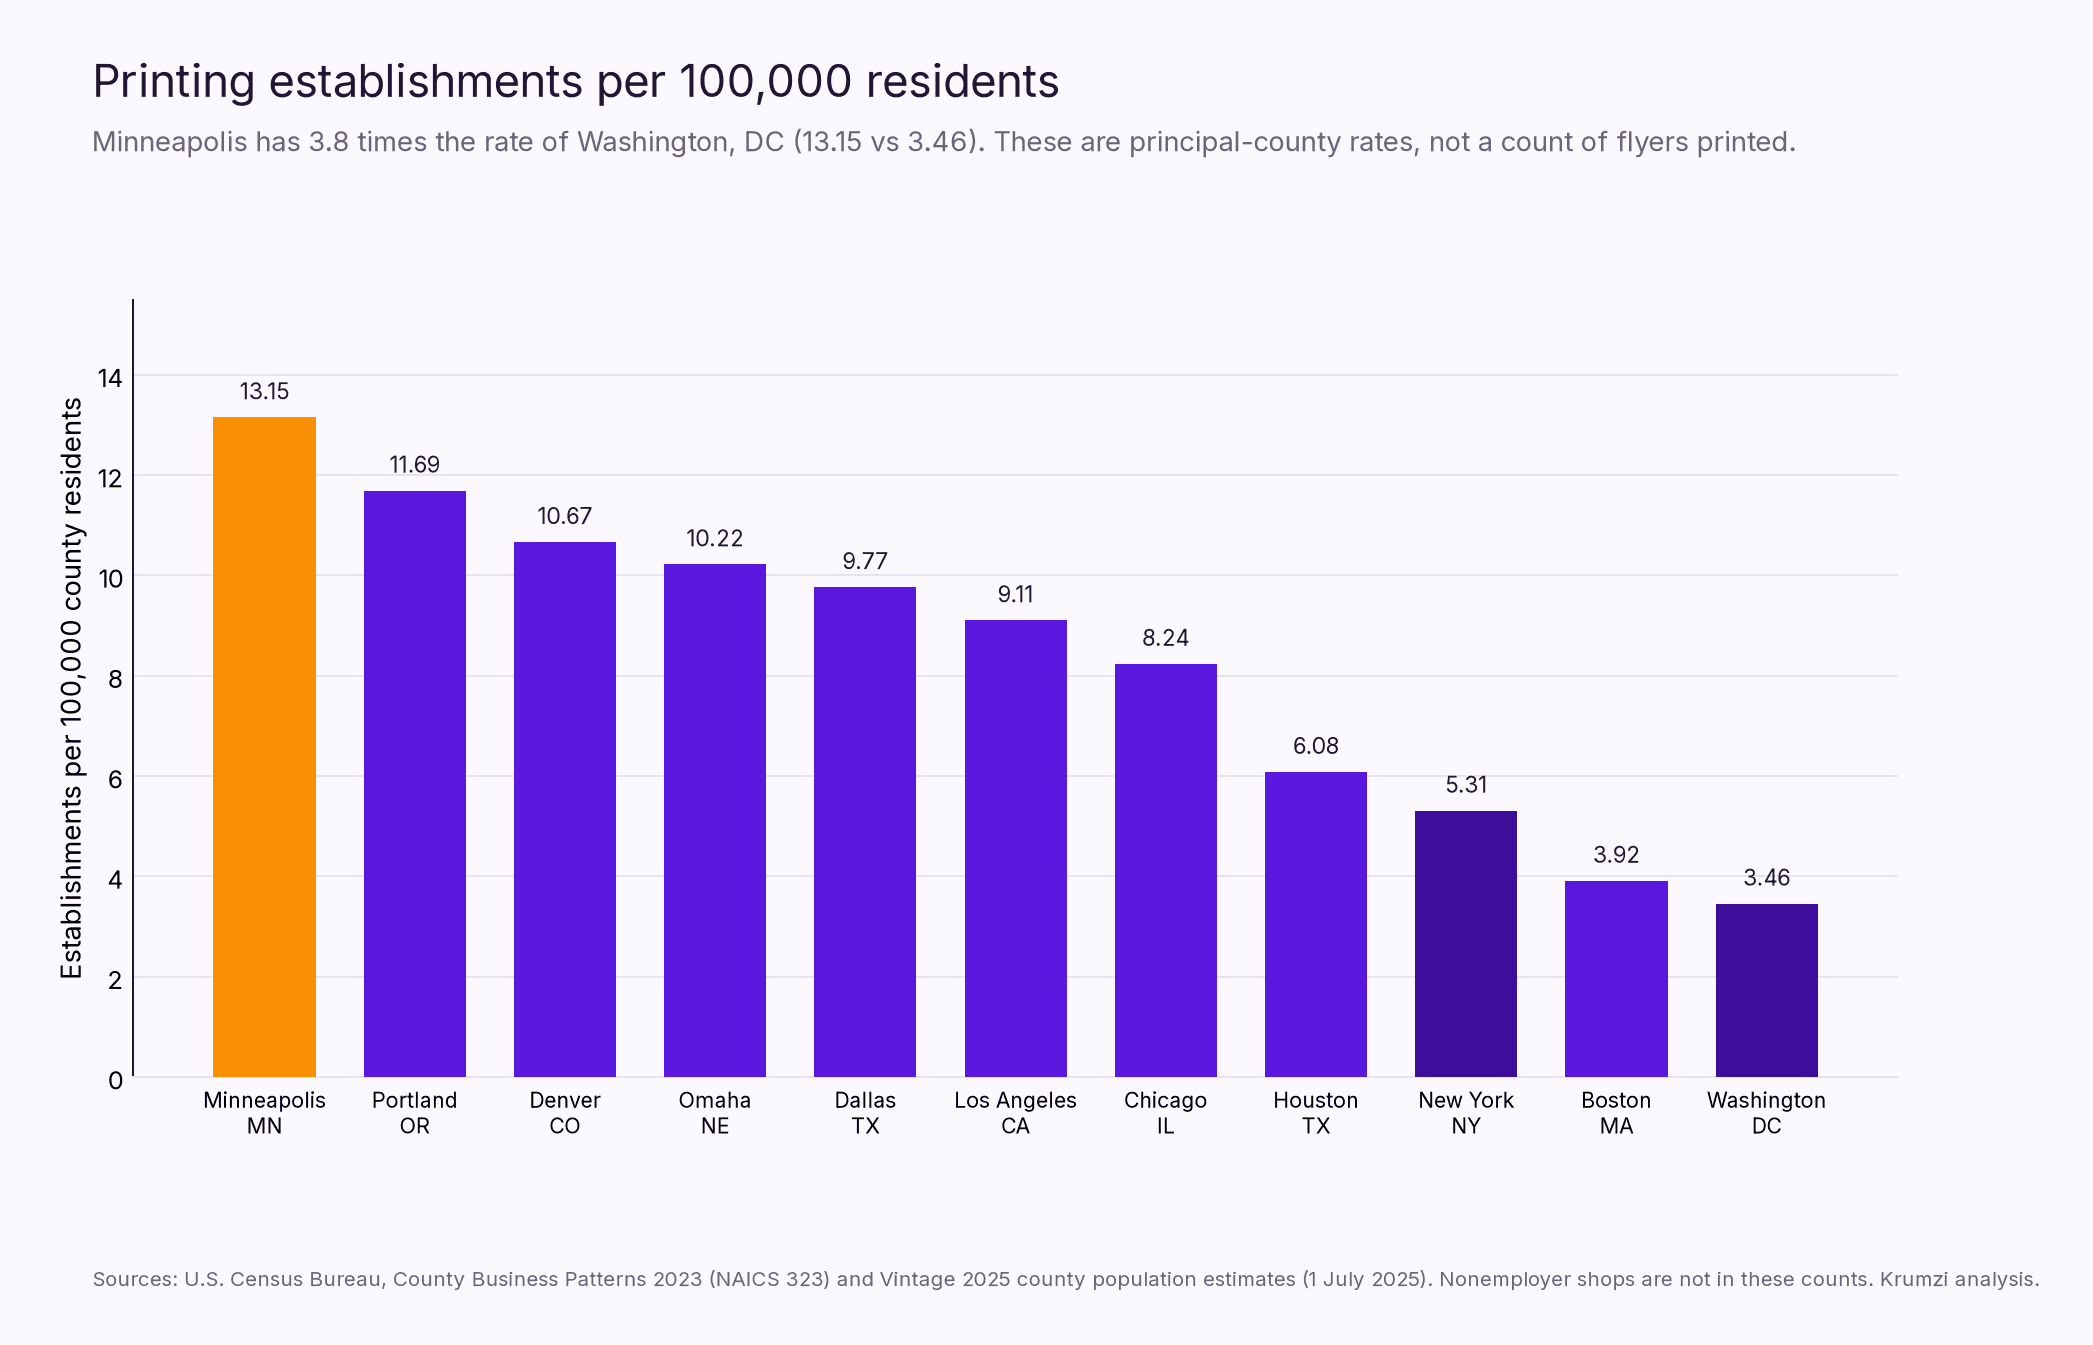
The rest of the index top 10 is Dallas, Memphis, Indianapolis, Louisville, Nashville, and Milwaukee. Memphis ranks sixth on the index even though it is 11th on the per-capita rate, because printing is 0.418 percent of local establishments, the highest share in the set. Minneapolis is just behind, at 0.417 percent.
Washington is last on both the index (7.56) and the per-capita rate. Just above it on the index are Boston (11.55), Bakersfield (12.83), Colorado Springs (15.06), and Philadelphia (17.47). Boston has only 31 payroll printing establishments in Suffolk County, or 3.915 per 100,000 residents.
Why New York City ranks 41st
New York City has 456 printing establishments across the five boroughs, the second-highest raw count in the set. That is a lot of shops in absolute terms, and it is still a thin industry relative to the city's size: 5.312 establishments per 100,000 residents, which ranks 40th on the per-capita rate and 41st on the index (24.98).
Los Angeles County has the most establishments, 883, and a mid-to-high rate of 9.108 per 100,000. Los Angeles ranks 11th on the index and Long Beach ranks 12th, with the same score, 59.25, because both cities are measured on Los Angeles County. Phoenix and Mesa similarly share Maricopa County (286 establishments, index 34.57) and rank 33rd and 34th.
Chicago has 428 establishments in Cook County and ranks 14th (index 54.29). Houston has 307 in Harris County and ranks 31st (35.44). The pattern is consistent: a large raw count is not the same thing as a dense printing industry.
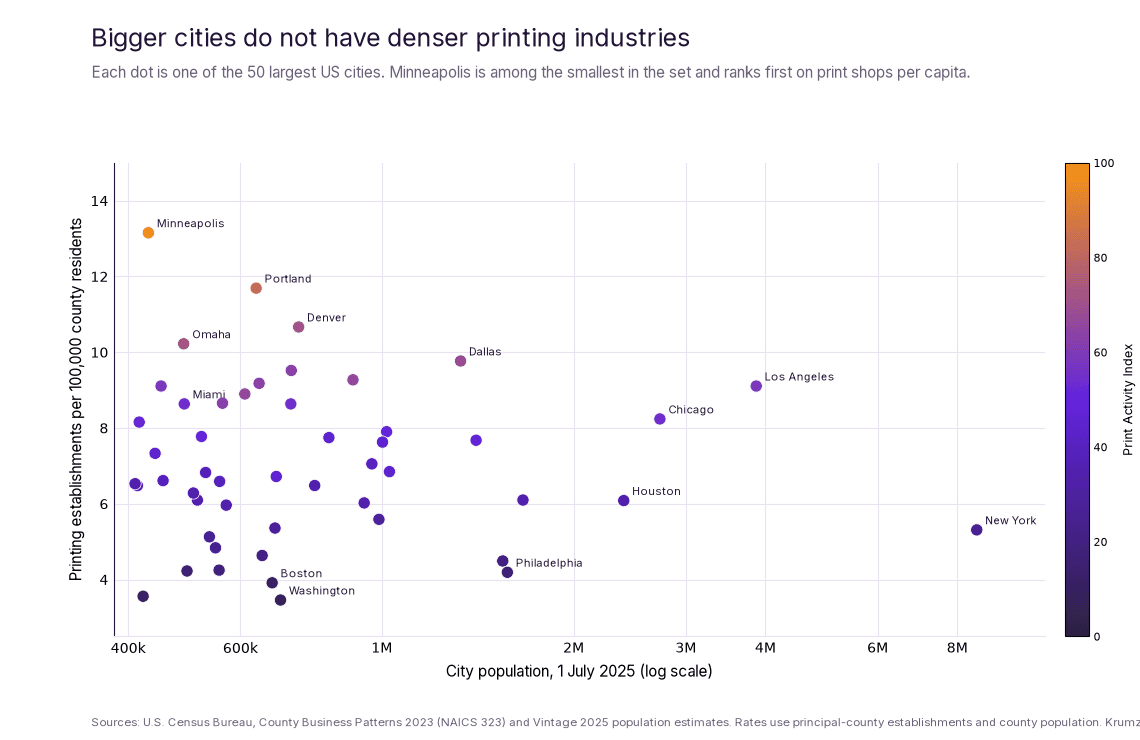
Minneapolis makes the same point from the other direction. It is the 46th-largest city in the set, with 430,324 residents as of 1 July 2025, and it still ranks first. Size is not the engine.
Every large city still has print shops
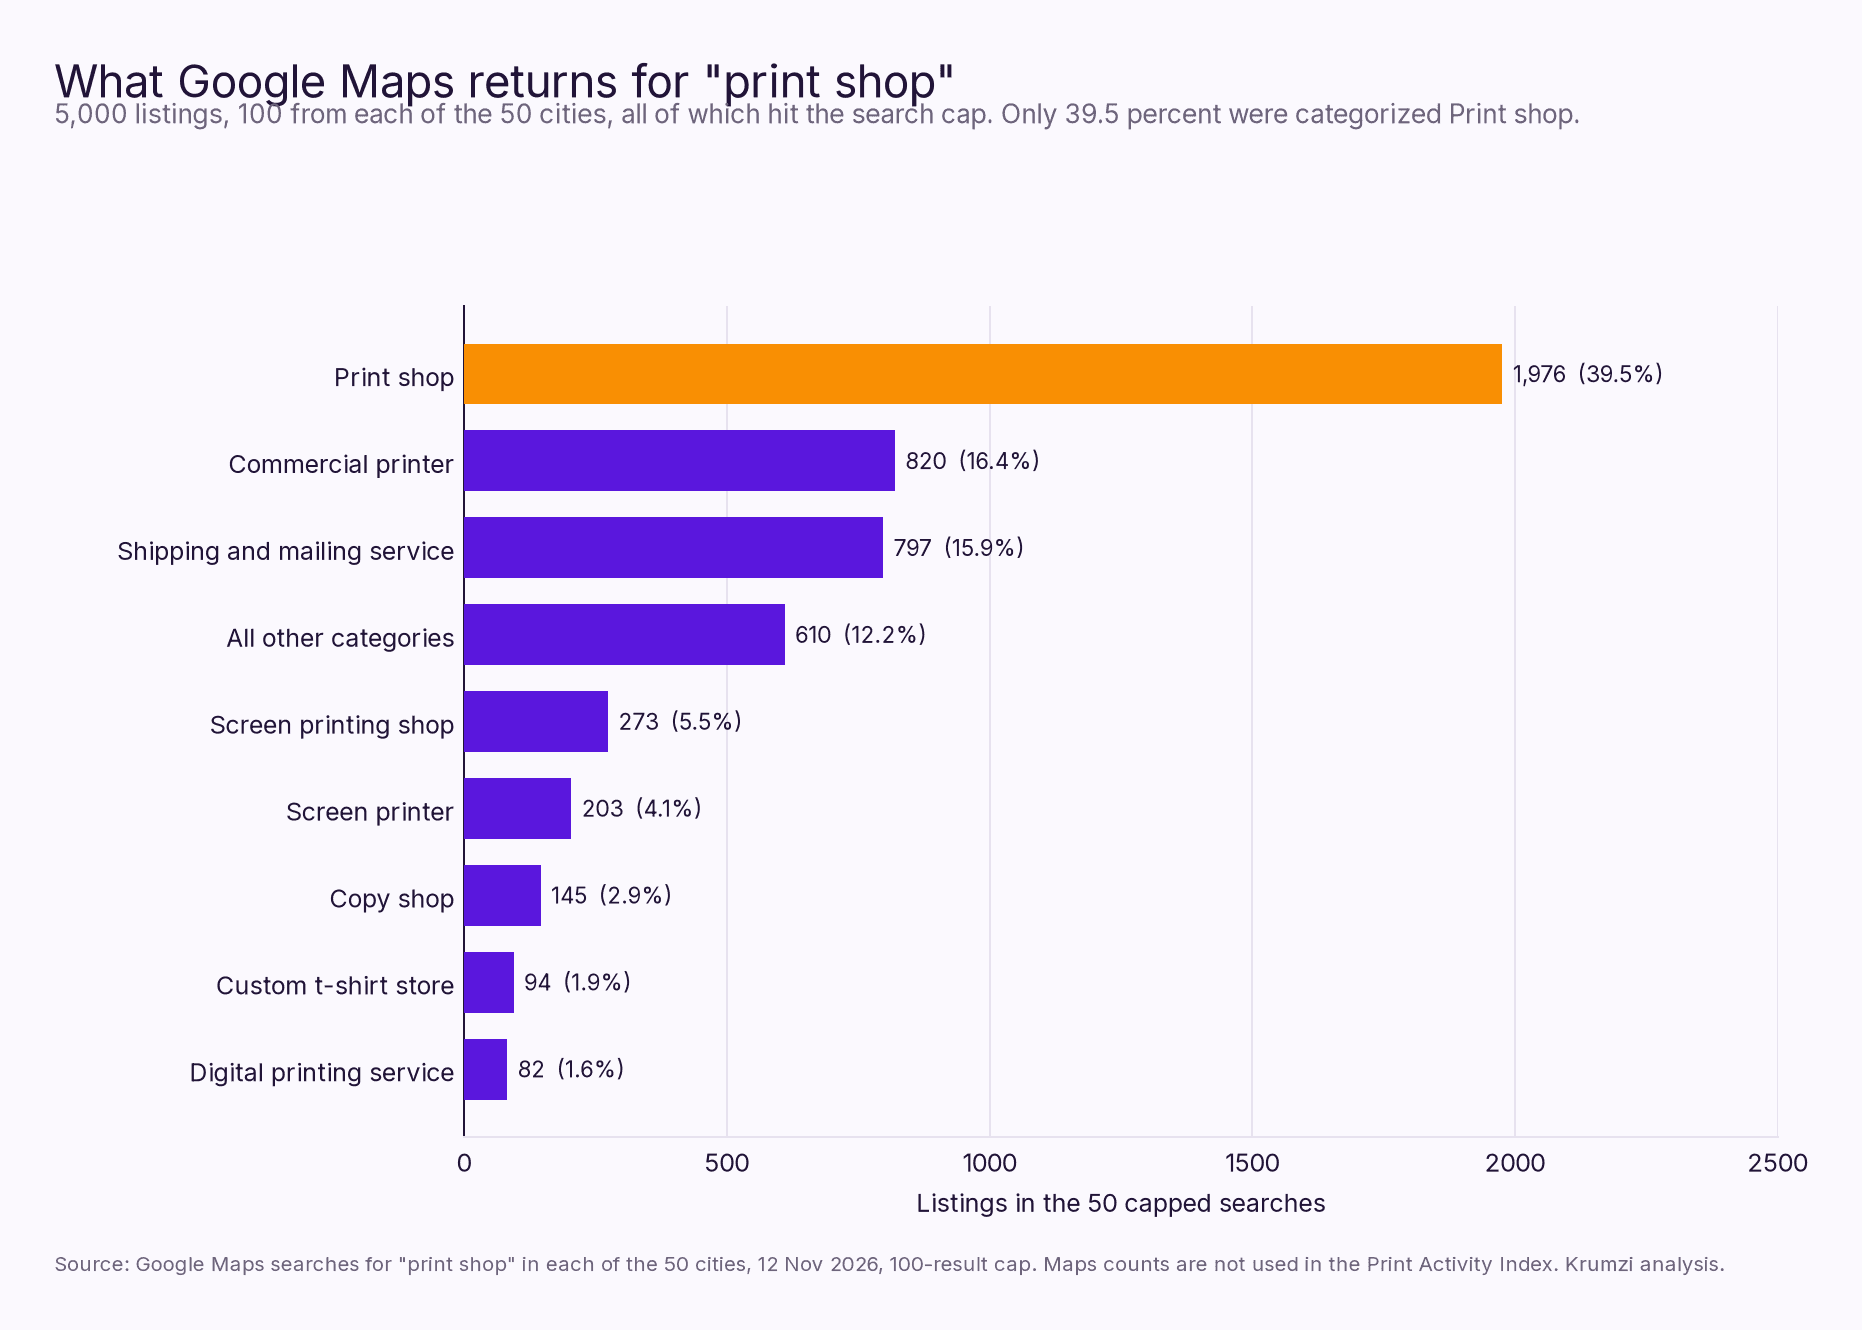
On 12 November 2026, a Google Maps search for "print shop" was run in each of the 50 cities, with a limit of 100 results. Every city returned 100 listings. That supports one claim only: each of these cities still has at least 100 listings. It cannot rank the cities by how many shops they have, because the search stopped at the cap in all 50 cases.
The listings are also a mixed bag. Of the 5,000 results, 1,976 (39.5 percent) were categorized Print shop, 820 (16.4 percent) Commercial printer, and 797 (15.9 percent) Shipping and mailing service. Screen printing shops, copy shops, sign shops, and office supply stores appear too. Maps is useful as a presence check, which is why those counts stay out of the index.
A second Maps figure is worth a glance if you live in a city that shares a name with another place. Of the 100 results, 99 included a New York City or Tucson address, and 98 included a San Francisco address. Aurora, Colorado, had only 54 of 100 with an Aurora address, and some results spilled into Aurora, Illinois. Washington, DC, results included 10 listings from the state of Washington. In-city share is a tightness check, not a shop census.
The full ranking of all 50 cities
The table below is the whole list, from Minneapolis at 1 to Washington, DC, at 50. Journalists looking for one city can jump straight to the row. The index is a 0 to 100 score. "Shops per 100k" is payroll printing establishments in the principal county, per 100,000 county residents. "Establishments" is the raw County Business Patterns count for NAICS 323 in that county. City population is the Census estimate for 1 July 2025.
Los Angeles and Long Beach share one county score, as do Phoenix and Mesa. Those pairs are not independently measured on the Census components.
| Rank | City | State | Index | Shops per 100k | Establishments | Principal county | City population, 2025 |
|---|---|---|---|---|---|---|---|
| 1 | Minneapolis | MN | 96.34 | 13.154 | 169 | Hennepin County, MN | 430,324 |
| 2 | Portland | OR | 81.27 | 11.692 | 93 | Multnomah County, OR | 635,109 |
| 3 | Omaha | NE | 72.25 | 10.223 | 62 | Douglas County, NE | 488,797 |
| 4 | Denver | CO | 70.95 | 10.667 | 79 | Denver County, CO | 740,613 |
| 5 | Dallas | TX | 68.55 | 9.769 | 260 | Dallas County, TX | 1,329,491 |
| 6 | Memphis | TN | 65.99 | 8.899 | 81 | Shelby County, TN | 609,647 |
| 7 | Indianapolis | IN | 65.88 | 9.272 | 92 | Marion County, IN | 901,116 |
| 8 | Louisville | KY | 64.07 | 9.180 | 73 | Jefferson County, KY | 641,962 |
| 9 | Nashville | TN | 64.01 | 9.519 | 71 | Davidson County, TN | 721,074 |
| 10 | Milwaukee | WI | 62.28 | 8.656 | 80 | Milwaukee County, WI | 562,407 |
| 11 | Los Angeles | CA | 59.25 | 9.108 | 883 | Los Angeles County, CA | 3,869,089 |
| 12 | Long Beach | CA | 59.25 | 9.108 | 883 | Los Angeles County, CA | 450,469 |
| 13 | Oklahoma City | OK | 55.38 | 8.636 | 71 | Oklahoma County, OK | 719,849 |
| 14 | Chicago | IL | 54.29 | 8.239 | 428 | Cook County, IL | 2,731,585 |
| 15 | Miami | FL | 53.64 | 8.637 | 242 | Miami-Dade County, FL | 489,812 |
| 16 | Tulsa | OK | 52.07 | 8.157 | 57 | Tulsa County, OK | 416,209 |
| 17 | Kansas City | MO | 50.53 | 7.776 | 57 | Jackson County, MO | 521,220 |
| 18 | Jacksonville | FL | 50.43 | 7.902 | 84 | Duval County, FL | 1,017,689 |
| 19 | San Diego | CA | 47.31 | 7.678 | 252 | San Diego County, CA | 1,406,106 |
| 20 | El Paso | TX | 46.11 | 6.721 | 59 | El Paso County, TX | 683,012 |
| 21 | Austin | TX | 45.77 | 7.628 | 106 | Travis County, TX | 1,002,632 |
| 22 | Oakland | CA | 45.45 | 7.332 | 120 | Alameda County, CA | 440,838 |
| 23 | San Francisco | CA | 45.15 | 7.747 | 64 | San Francisco County, CA | 826,079 |
| 24 | Fort Worth | TX | 44.28 | 6.849 | 154 | Tarrant County, TX | 1,028,117 |
| 25 | Charlotte | NC | 40.96 | 7.054 | 87 | Mecklenburg County, NC | 964,784 |
| 26 | Albuquerque | NM | 38.89 | 6.591 | 44 | Bernalillo County, NM | 556,588 |
| 27 | Virginia Beach | VA | 38.23 | 6.612 | 30 | Virginia Beach city, VA | 453,737 |
| 28 | Atlanta | GA | 37.33 | 6.826 | 75 | Fulton County, GA | 529,110 |
| 29 | Tampa | FL | 36.31 | 6.480 | 102 | Hillsborough County, FL | 413,554 |
| 30 | Aurora | CO | 35.95 | 6.530 | 44 | Arapahoe County, CO | 410,053 |
| 31 | Houston | TX | 35.44 | 6.085 | 307 | Harris County, TX | 2,397,315 |
| 32 | Seattle | WA | 35.42 | 6.482 | 152 | King County, WA | 784,777 |
| 33 | Phoenix | AZ | 34.57 | 6.099 | 286 | Maricopa County, AZ | 1,665,481 |
| 34 | Mesa | AZ | 34.57 | 6.099 | 286 | Maricopa County, AZ | 513,656 |
| 35 | Raleigh | NC | 34.57 | 6.284 | 79 | Wake County, NC | 506,306 |
| 36 | Baltimore | MD | 34.48 | 5.965 | 34 | Baltimore city, MD | 569,997 |
| 37 | Columbus | OH | 34.41 | 6.023 | 82 | Franklin County, OH | 938,396 |
| 38 | San Jose | CA | 28.34 | 5.589 | 107 | Santa Clara County, CA | 989,814 |
| 39 | Las Vegas | NV | 27.54 | 5.359 | 129 | Clark County, NV | 679,817 |
| 40 | Sacramento | CA | 25.95 | 5.128 | 83 | Sacramento County, CA | 536,449 |
| 41 | New York | NY | 24.98 | 5.312 | 456 | Five NYC boroughs | 8,584,629 |
| 42 | Tucson | AZ | 23.74 | 4.839 | 52 | Pima County, AZ | 548,371 |
| 43 | Detroit | MI | 22.14 | 4.635 | 82 | Wayne County, MI | 649,095 |
| 44 | San Antonio | TX | 21.08 | 4.491 | 97 | Bexar County, TX | 1,548,422 |
| 45 | Fresno | CA | 18.30 | 4.249 | 44 | Fresno County, CA | 555,549 |
| 46 | Philadelphia | PA | 17.47 | 4.192 | 66 | Philadelphia County, PA | 1,574,281 |
| 47 | Colorado Springs | CO | 15.06 | 4.227 | 32 | El Paso County, CO | 494,743 |
| 48 | Bakersfield | CA | 12.83 | 3.560 | 33 | Kern County, CA | 422,165 |
| 49 | Boston | MA | 11.55 | 3.915 | 31 | Suffolk County, MA | 672,973 |
| 50 | Washington | DC | 7.56 | 3.460 | 24 | District of Columbia, DC | 693,645 |
Establishment counts are from County Business Patterns 2023. City population is the 1 July 2025 Census estimate. The Maps check is from 12 November 2026.
How to spend less time chasing the wrong shop
A rank is a starting point, not a recommendation of a single printer. A city with a high index still has a mix of commercial plants, copy shops, and specialists. A city with a low index still has places that can print a short run of flyers. The useful move is to get two or three local quotes and to arrive with a clean, print-ready file.
If you are making that file yourself, our guides on how to make a flyer with AI, how to add a QR code to a flyer, and how to make a brochure walk through the design side. For a wider set of pieces, see how to create marketing materials without a designer. If you would rather describe the piece and get an editable layout, Krumzi's AI flyer maker turns a brief into a design you can still fix before you send it to the shop.
A low-resolution export or a QR code that does not scan will waste the print run, no matter which city you are in. If you are tempted to design the flyer in a chat tool, read how to make a flyer with ChatGPT first, then move the work into a real editor.
Methodology
Compiled 12 November 2026. The universe is the 50 most populous US incorporated places in the Census Bureau's Vintage 2025 city and town population estimates, ranked by the 1 July 2025 estimate. Rank 1 is New York City, with 8,584,629 residents. Rank 50 is Aurora, Colorado, with 410,053. Combined place population is 51,316,953.
Printing supply comes from the Census Bureau's County Business Patterns 2023 datasets, county and national files, industry NAICS 323, Printing and Related Support Activities, all legal forms of organization. The US totals in that file are 22,301 establishments and 386,248 employees. The 48 unique principal-county groups that cover these 50 cities contain 6,195 of those establishments, or 27.8 percent of the national total. County Business Patterns counts establishments with payroll. It does not count nonemployer shops.
Each city is assigned a principal county, or the five boroughs in the case of New York City. Rates use principal-county printing establishments divided by that county's 2025 population, not metro-wide establishments divided by city population. Aurora, Colorado, is assigned Arapahoe County only, not the full Denver metro. Los Angeles and Long Beach both use Los Angeles County. Phoenix and Mesa both use Maricopa County.
The formulas are:
- Print shops per 100,000 county residents = 100,000 x (NAICS 323 establishments in the principal county) / (2025 principal-county population)
- Print share of establishments (percent) = 100 x (323 establishments) / (all CBP establishments in the county)
- All establishments per 100,000 county residents = 100,000 x (all CBP establishments in the county) / (2025 principal-county population)
Each component is min-max normalized to 0-100 across the 50 cities, then combined:
Print Activity Index = 0.60 x (print shops per 100,000) + 0.30 x (print share of establishments) + 0.10 x (all establishments per 100,000)
The observed ranges used for normalization are 3.460 to 13.154 shops per 100,000, 0.101 to 0.418 percent print share, and 1,548.107 to 4,040.534 all establishments per 100,000. The 60/30/10 split gives most weight to print-shop density, some weight to how large printing is among local businesses, and a light weight to overall business density.
Google Maps "print shop" counts are reported as context and are not used in the index, because every city hit the 100-result cap on 12 November 2026.
This index is not a count of flyers printed, print impressions, or print-shop revenue. NAICS 323 includes books, labels, business forms, and other printing, not only flyers. The establishment counts are from 2023 and the population figures are mid-2025, so the rates mix two vintages. A city that does not fill its county is measured at county scale, not city-proper scale. Shared-county pairs are not independently measured on the Census components. Maps results include shipping stores, sign shops, and related categories, and they stop at 100 listings.
How to cite this study
Krumzi, "Print Activity Index: The 50 Largest US Cities, Ranked (2026)," 12 November 2026, https://www.krumzi.com/blog/print-activity-index. Establishment counts are from Census County Business Patterns 2023, NAICS 323. City and county population figures are Census Vintage 2025 estimates for 1 July 2025. The Google Maps check was run on 12 November 2026.
Use the numbers as a ranked, sourced comparison, not as a shop directory and not as a measure of how many flyers a city prints.
If you want the design part done for you before you take a file to a local printer, start a free trial and describe your first flyer.
3-day free trial, card needed. No charge until day 4. Cancel online anytime.
Frequently Asked Questions
Which US city has the most print shops per capita?
Minneapolis ranks first among the 50 largest US cities. Hennepin County, which contains Minneapolis, has 13.154 printing establishments per 100,000 residents, the highest rate in the set, and a Print Activity Index of 96.34. Portland, Oregon, is second, at 11.692 per 100,000. These are payroll establishments in the principal county, not a count of flyers printed.
Does the Print Activity Index measure how many flyers are printed?
No. It measures printing establishments per capita, plus printing's share of local businesses and overall business density, from Census County Business Patterns. There is no official city-level series of flyer volume in the sources used for this study. NAICS 323 also covers books, labels, and other printing, not only marketing flyers.
Why does New York City rank 41st?
New York City has 456 printing establishments in the five boroughs, the second-highest raw count in the set, but only 5.312 shops per 100,000 residents. That rate ranks 40th among the 50 cities, and the Print Activity Index rank is 41st, with a score of 24.98. A large city can have many shops and still have a thin printing industry relative to its population.
Why do Los Angeles and Long Beach have the same score?
They share Los Angeles County, which has 883 printing establishments, the most in the set. Both cities therefore receive the same county rate, 9.108 per 100,000, and the same index, 59.25. Los Angeles ranks 11th and Long Beach ranks 12th. Phoenix and Mesa share Maricopa County in the same way and rank 33rd and 34th.
Do all of the largest US cities still have print shops?
Yes, at least by a capped Google Maps check. A "print shop" search in each of the 50 cities on 12 November 2026 returned 100 listings, the search cap. That supports the claim that every city has at least 100 listings. It cannot say which city has the most, and the results include shipping stores and other related categories, not only printers.
A month of posts, designed before your coffee cools
Describe the post. Krumzi designs it from scratch, on your brand, fully editable.
Start free trial3-day free trial, card needed. No charge until day 4. Cancel online anytime.